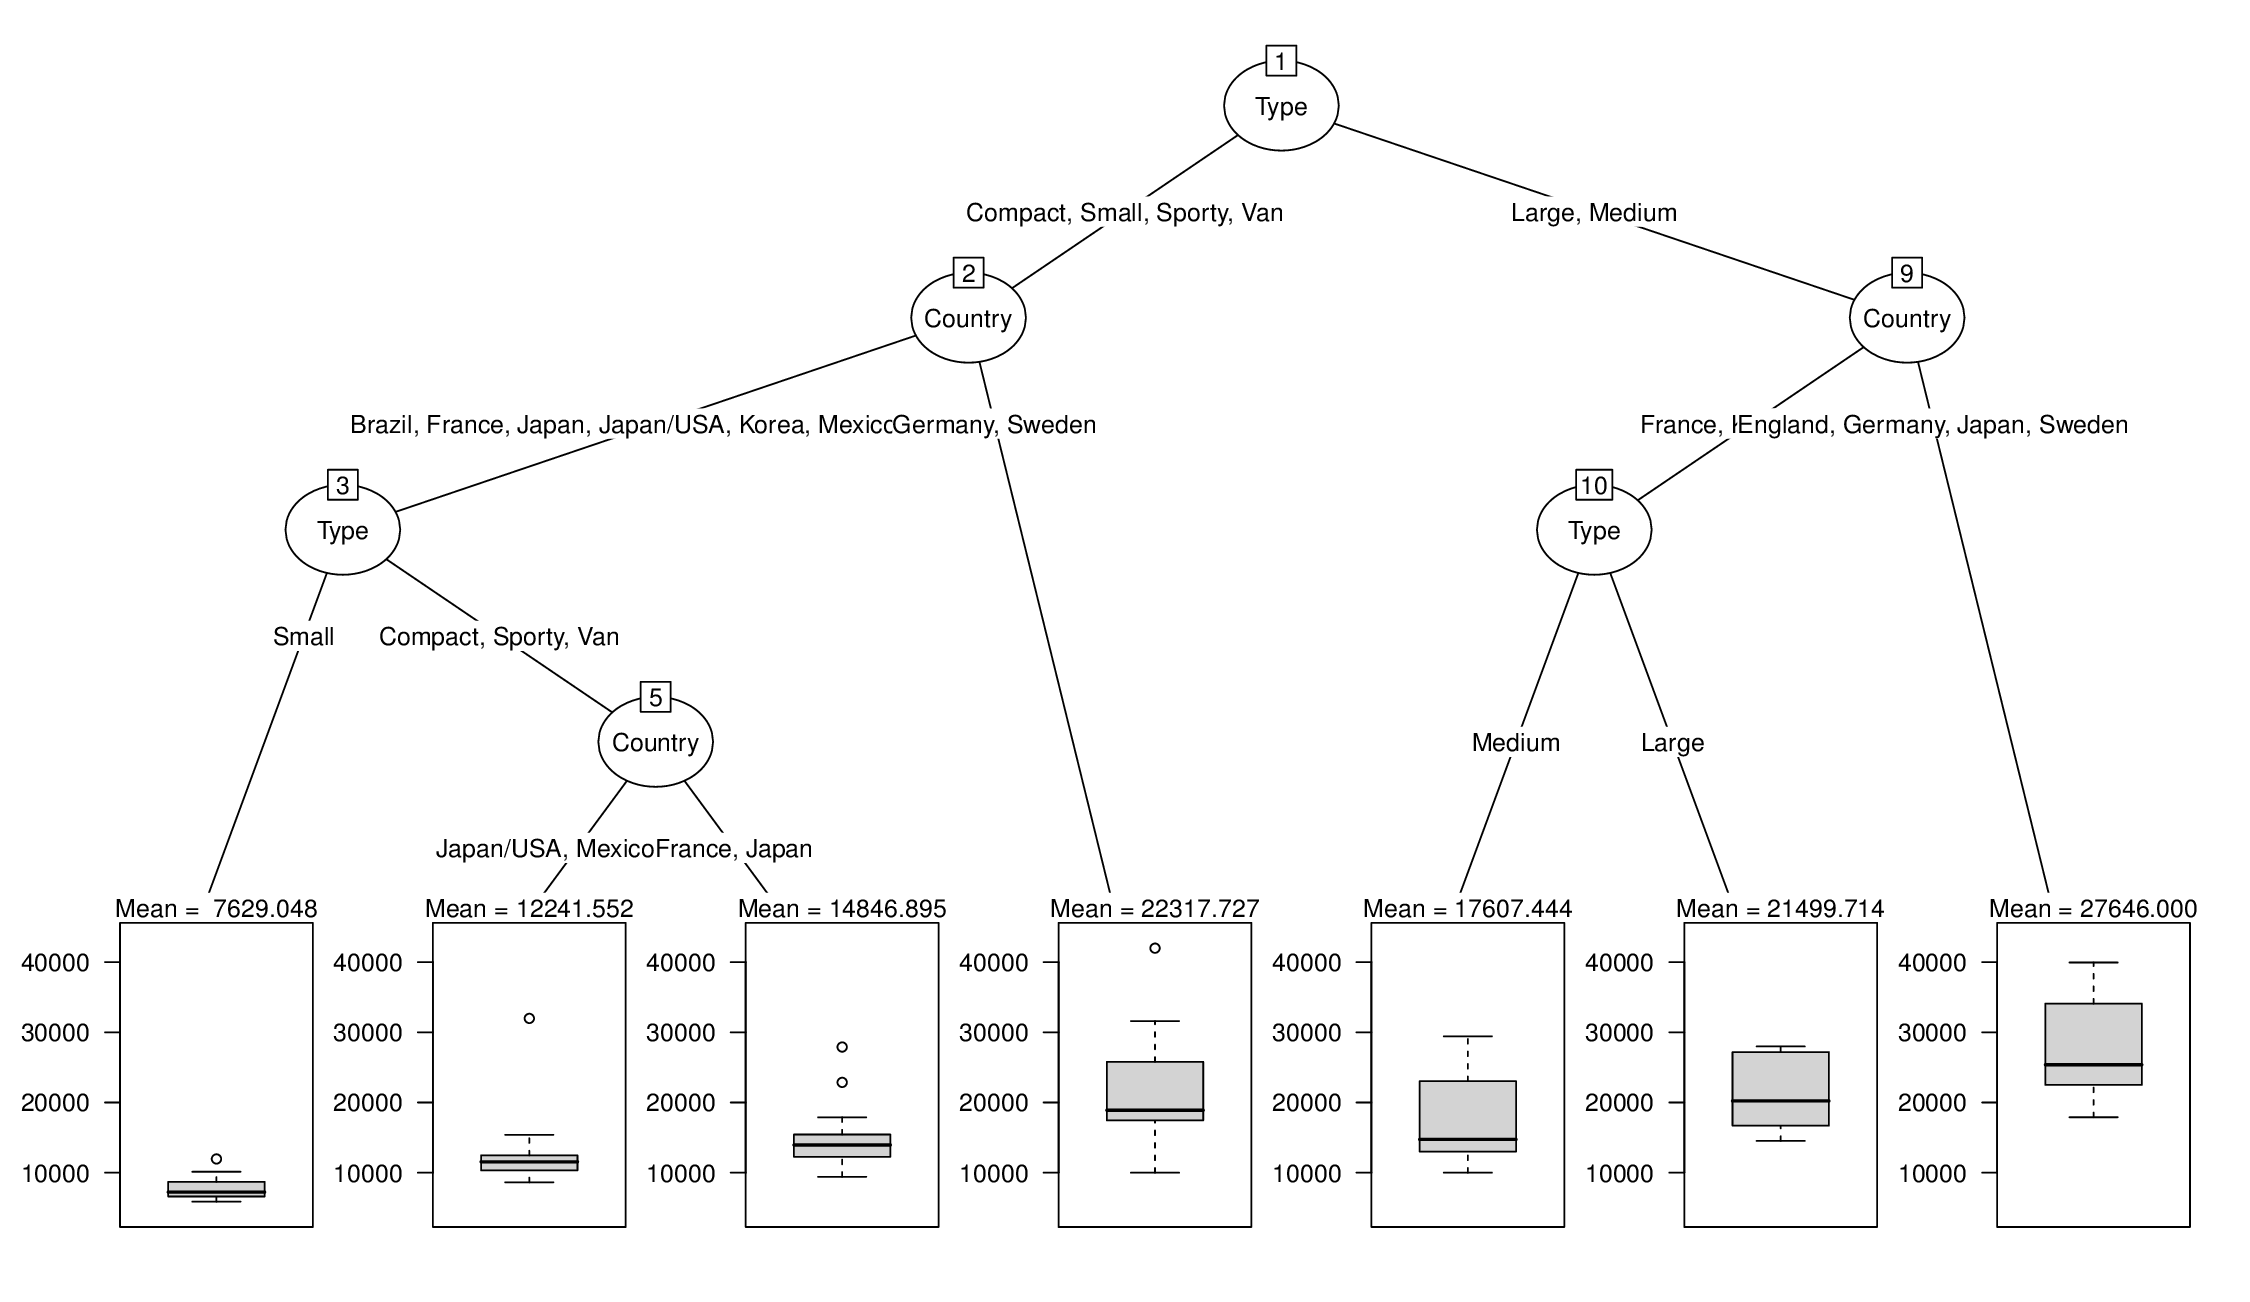
I'm trying to plot a regression tree generated with rpart using partykit. Let's suppose the formula used is y ~ x1 + x2 + x3 + ... + xn. What I would like to achieve is a tree with boxplots in terminal nodes, with a label on top listing the 10th, 50th, and 90th percentiles of the distribution of the y values for the observations assigned to each node, i.e., above the boxplot representing each terminal node, I would like to display a label like "10th percentile = $200, mean = $247, 90th percentile = $292."
The code below generates the desired tree:
library("rpart")
fit <- rpart(Price ~ Mileage + Type + Country, cu.summary)
library("partykit")
tree.2 <- as.party(fit)
The following code generates the terminal plots but without the desired labels on the terminal nodes:
plot(tree.2, type = "simple", terminal_panel = node_boxplot(tree.2,
  col = "black", fill = "lightgray", width = 0.5, yscale = NULL,
  ylines = 3, cex = 0.5, id = TRUE))
If I can display a mean y-value for a node, then it should be easy enough to augment the label with percentiles, so my first step is to display, above each terminal node, just its mean y-value.
I know I can retrieve the mean y-value within a node (here node #12) with code such as this:
colMeans(tree.2[12]$fitted[2])
So I tried to create a formula and use the mainlab parameter of the boxplot panel-generating function to generate a label containing this mean:
labf <- function(node) colMeans(node$fitted[2])
plot(tree.2, type = "simple", terminal_panel = node_boxplot(tree.2,
  col = "black", fill = "lightgray", width = 0.5, yscale = NULL,
  ylines = 3, cex = 0.5, id = TRUE, mainlab = tf))
Unfortunately, this generates the error message:
Error in mainlab(names(obj)[nid], sum(wn)) : unused argument (sum(wn)).
But it seems this is on the right track, since if I use:
plot(tree.2, type = "simple", terminal_panel = node_boxplot(tree.2,
  col = "black", fill = "lightgray", width = 0.5, yscale = NULL,
  ylines = 3, cex = 0.5, id = TRUE, mainlab = colMeans(tree.2$fitted[2])))
then I get the correct mean y-value at the root node displayed. I would appreciate help with fixing the error described above so that I show the mean y-values for each separate terminal node. From there, it should be easy to add in the other percentiles and format things nicely.


fit <- rpart(Price ~ Mileage + Type + Country, cu.summary)par(xpd = TRUE)plot(fit, compress = TRUE)text(fit, use.n = TRUE)tree.2<-as.party(fit)plot(tree.2)This will generate a tree plot with boxplots at the terminal nodes. What I'm trying to do is to put the mean (and later some other percentiles) above each of the terminal nodes in a label. So instead of "Node 4 (n=21)" the leftmost terminal node would have a label saying something like "mean = 7629.048" – Martell