right/left align subtitle position in plot
Asked Answered
H

1

6

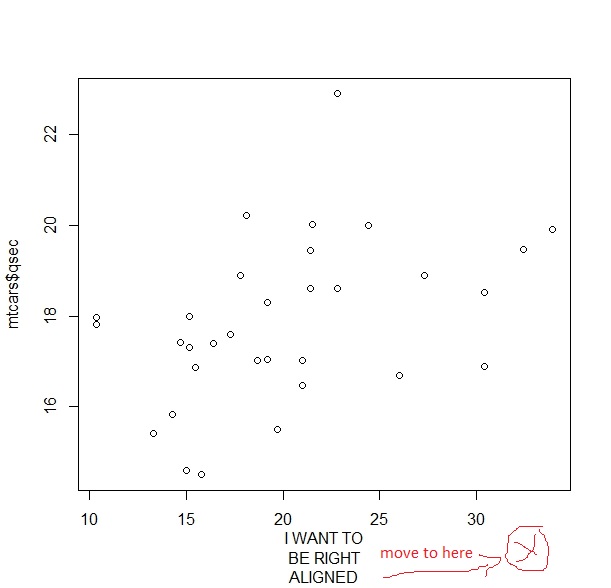
How can I change the position of the subtitle in r "base" plot. Is there a special argument? I want to dynamically have the subtitle left or right aligned.

data

plot(mtcars$mpg,mtcars$qsec,xlab="",sub="I WANT TO\nBE RIGHT\nALIGNED")

plot data with desired output in red

enter image description here

EDIT

plottR <- function(...) {
    plot(...)
}

plottR(mtcars$mpg, mtcars$qsec, ylab="Y Must Center", xlab="X Must Center", main="Must center", sub="Must right-align",adj=1)

Can I input something to plottR so it only aligns the subtitle?

EDIT2

I just found out. I can evaluate the title() inside plot.

plottR(mtcars$mpg, mtcars$qsec, ylab="Y Must Center", xlab="X Must Center", main = "Must Center", title(sub ="Hey Only\nim right\ncool huh?",adj=1))
Heterography answered 29/11, 2017 at 10:0 Comment(0)
N
4

You may use the par setting adj. From the help page:

A value of 0 produces left-justified text, 0.5 (the default) centered text and 1 right-justified text. (Any value in [0, 1] is allowed, and on most devices values outside that interval will also work.)

The drawback is that it influences the way text is justified for text, mtext, and title. Hence we have to break up the code in pieces if we want to leave e.g. the title and the Y-axis title untouched.

You could use the following code:

# store the current value of adj
adj.old <- par()$adj    # default is 0.5

# plot with the current value of adj
plot(mtcars$mpg, mtcars$qsec, xlab="")

# set adj to right-aligned and plot the subtitle
par(adj = 1)
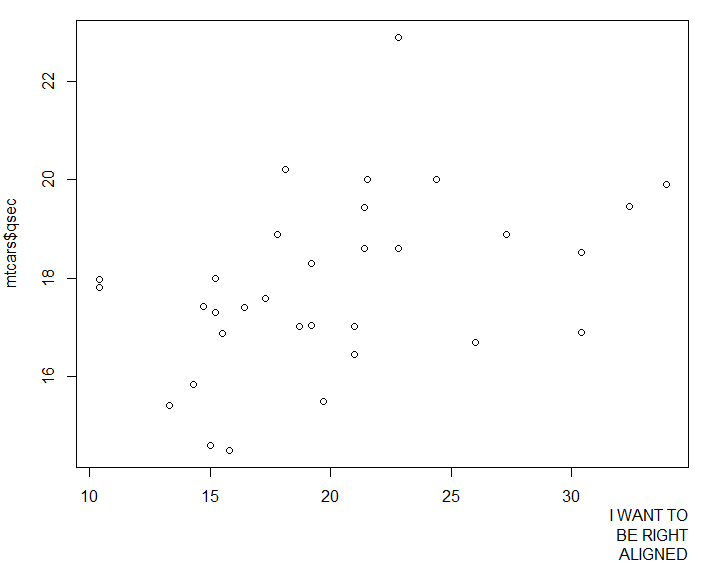
title(sub = "I WANT TO\nBE RIGHT\nALIGNED")

# reset adj to previous value
par(adj = adj.old)

This generates the following graph:

enter image description here

Nitpicking answered 29/11, 2017 at 10:27 Comment(6)
thank you. I found adj parameter. Its not mentioned in my question but the adj would also shift the main title. Is there a way to only shift the subtitle?Heterography
@AndreElrico this is essentially what I did in the code above. I generate a graph with plot without the subtitle but with the Y axis title (you could add a main title here as well) under conditions where adj has its default value (0.5). Then, I change adj = 1 and I add the subtitle with the title function. Lastly I reset adj.Nitpicking
it works. Thats probably the best solution there is. Sadly im working with a function that calls plot and i am working in the ... argument. So i cant procedurally code in there. But thats a good workaround :-)Heterography
@AndreElrico It is just a suggestion: you could take the code above, graph included, and post a new question asking for an alternative that fits your needs. If you let me inform me about the new question I will cenrtainly consider voting it up. Good Luck!Nitpicking
hey i just updated the question to match my situation more precisely. If you have any ideas, suggestions let me know :-)Heterography
@AndreElrico I really think you should post a new question, asking for an alternative way. This question is already "old" now, and will attract less attention.Nitpicking

© 2022 - 2024 — McMap. All rights reserved.