How can I align multiple plots by their titles instead of plot area?
Asked Answered
E

2

5

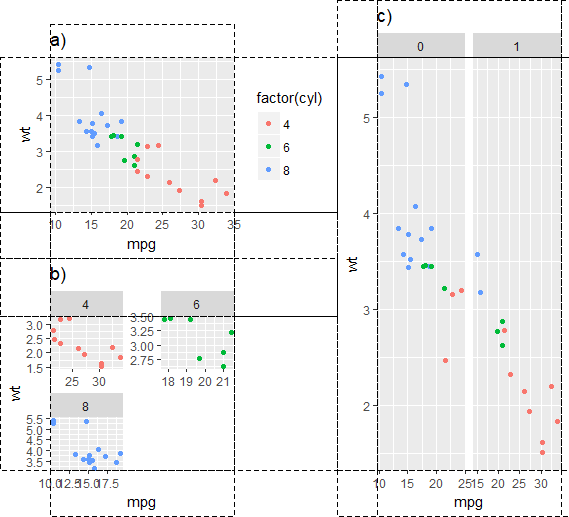
I'm using egg to align multiple plots on a page. I'm wondering if it's possible to align two columns by the titles a) and c) instead of plot area? Thanks!

Code:

library(egg)
library(grid)

p1 <- ggplot(mtcars, aes(mpg, wt, colour = factor(cyl))) +
  geom_point() + ggtitle("a)")
p1

p2 <- ggplot(mtcars, aes(mpg, wt, colour = factor(cyl))) +
  geom_point() + facet_wrap(~ cyl, ncol = 2, scales = "free") +
  guides(colour = "none") +
  theme() + ggtitle("b)")
p2

p3 <- ggplot(mtcars, aes(mpg, wt, colour = factor(cyl))) +
  geom_point() + facet_grid(. ~ am, scales = "free") + guides(colour="none") +
  ggtitle("c)")
p3

g1 <- ggplotGrob(p1)

g2 <- ggplotGrob(p2)

g3 <- ggplotGrob(p3)

fg1 <- gtable_frame(g1, debug = TRUE)
fg2 <- gtable_frame(g2, debug = TRUE)
fg12 <- gtable_frame(gtable_rbind(fg1, fg2),
                     width = unit(2, "null"),
                     height = unit(1, "null"))
fg3 <-
  gtable_frame(
    g3,
    width = unit(2, "null"),
    height = unit(1, "null"),
    debug = TRUE
  )
grid.newpage()
combined <- gtable_cbind(fg12, fg3)
grid.draw(combined)  

Plot:

enter image description here

Esdraelon answered 6/12, 2017 at 6:0 Comment(0)
E
4

I found another way by using cowplot package

left_col <- cowplot::plot_grid(p1 + ggtitle(""), p2 + ggtitle(""), 
                               labels = c('a)', 'b)'), label_size = 14,
                               ncol = 1, align = 'v', axis = 'lr') 
cowplot::plot_grid(left_col, p3 + ggtitle(""), 
                   labels = c('', 'c)'), label_size = 14,
                   align = 'h', axis = 'b')

enter image description here

See also here

Edit:

A recently developed package patchwork for ggplot2 can also get the job done

library(patchwork)

{
  p1 + {p2} + patchwork::plot_layout(ncol = 1)
} / p3 + patchwork::plot_layout(ncol = 2)

enter image description here

Esdraelon answered 6/12, 2017 at 6:50 Comment(1)
Your left column in your cowplot solution is not fully aligned. I think it needs axis = 'lr' instead of axis = 'r', but I didn't try this out.Conscription
H
2

Adding a blank dummy faceting variable to plot p1/ a) seems like the easiest solution

p1 <- ggplot(data.frame(mtcars, dummy=''), 
             aes(mpg, wt, colour = factor(cyl))) +
  geom_point() + ggtitle("a)") +
  facet_wrap(~dummy)

enter image description here

Hydrokinetic answered 6/12, 2017 at 6:19 Comment(1)
Thank you very much for the help! That's pretty clever way to do it. However, I'm looking for a more generic solution. See the answer that I've just foundEsdraelon

© 2022 - 2024 — McMap. All rights reserved.