Vertically align of plots of different heights using cowplot::plot_grid() when using coord_equal()
Asked Answered
S

2

4

I am trying to combine two ggplot objects using cowplot::plot_grid() and vertically align them. This is normally quite simple using align = "v".

dat1 <- data.frame(x = rep(1:10, 2), y = 1:20)
dat2 <- data.frame(x = 1:10, y = 1:10)
plot1 <- ggplot(dat1, aes(x = x, y = y)) + geom_point()
plot2 <- ggplot(dat2, aes(x = x, y = y)) + geom_point()
cowplot::plot_grid(plot1, plot2, ncol = 1, align = "v")

image 1

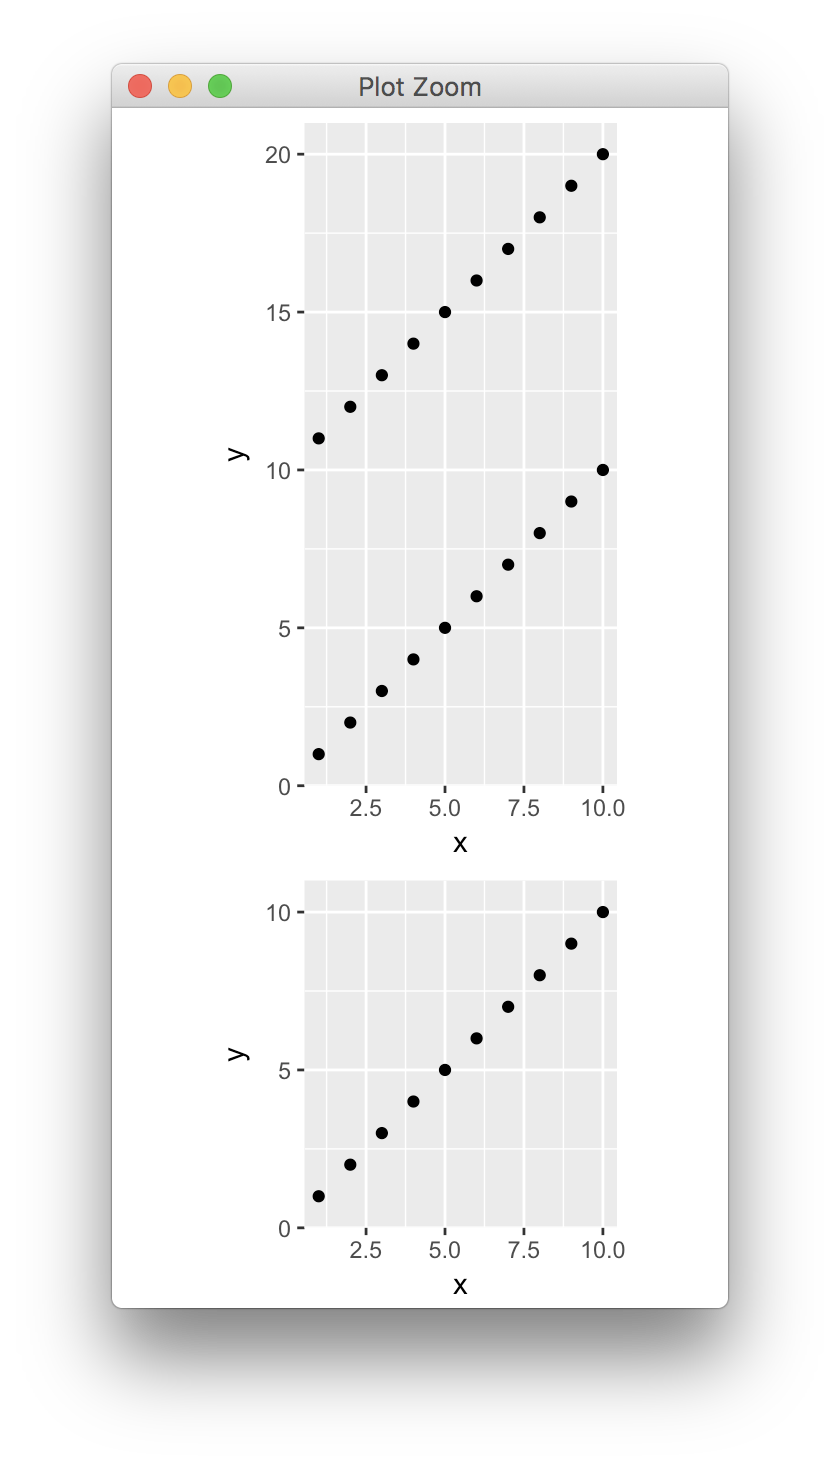
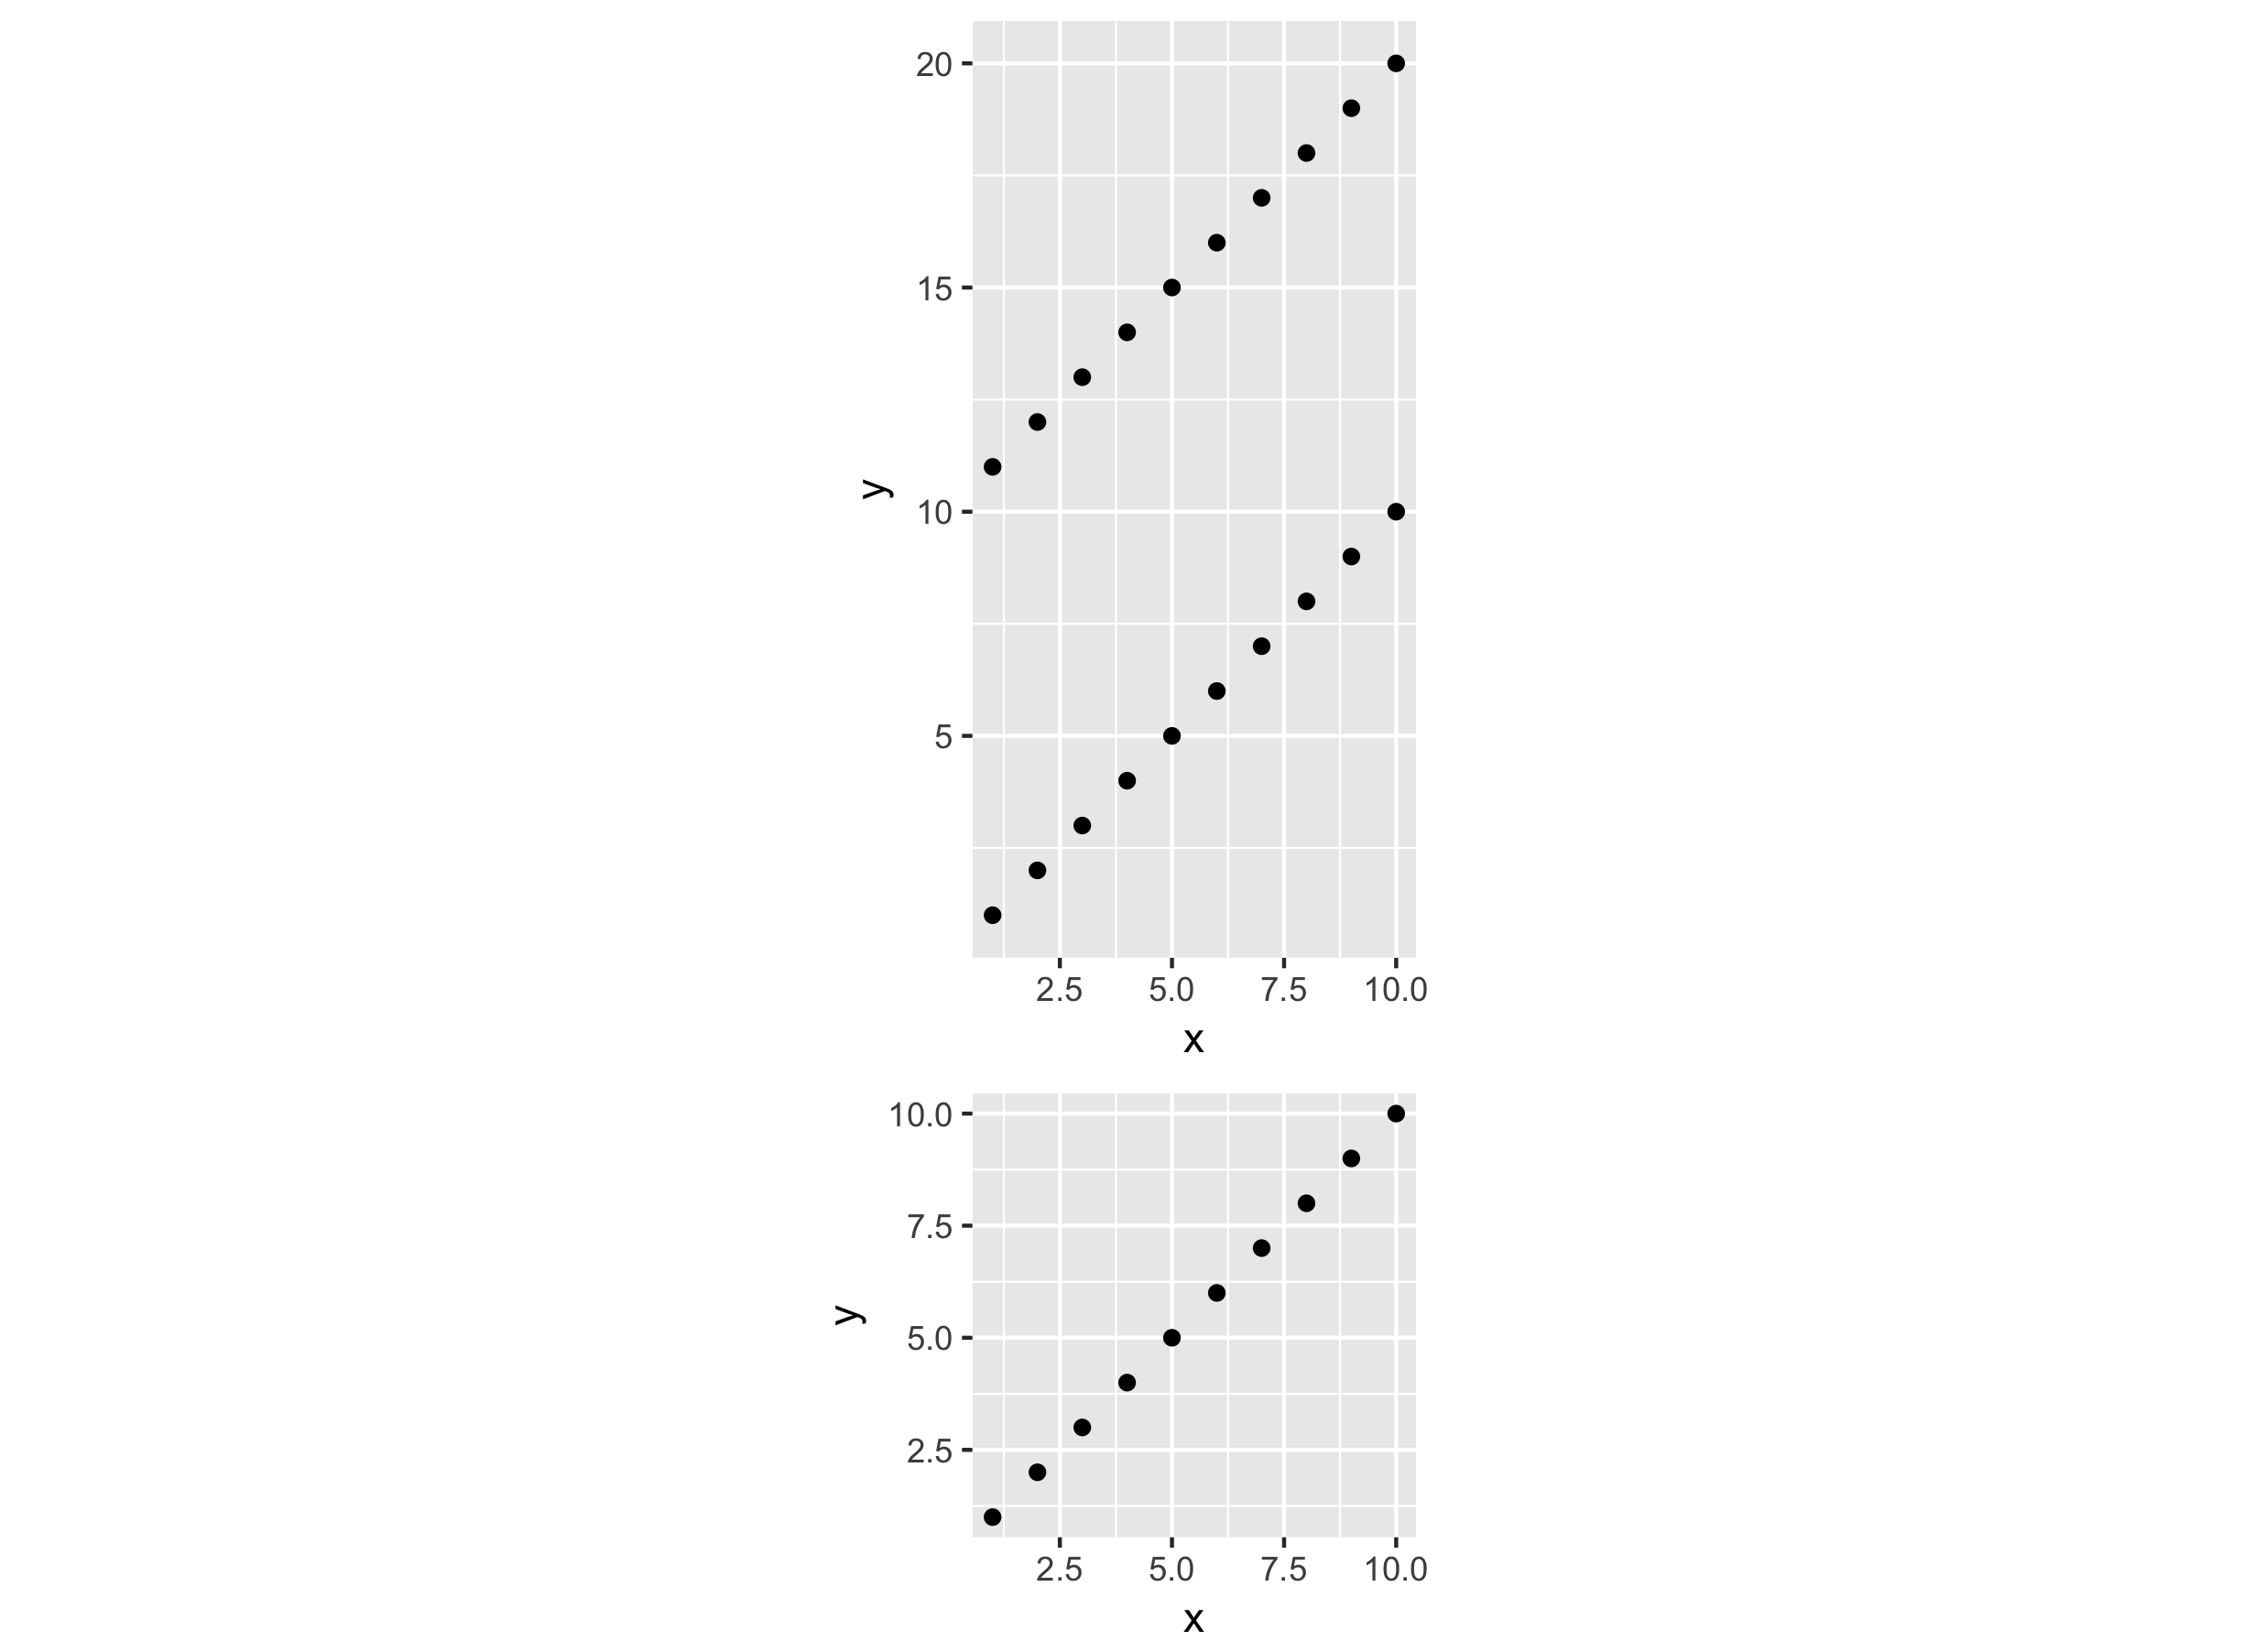
However, this approach fails when the ggplots use coord_equal() because plot_grid() cannot modify the axes when the aspect ratio is forced. Instead, the default is to keep the heights of each plot the same.

plot1 <- ggplot(dat1, aes(x = x, y = y)) + geom_point() + coord_equal()
plot2 <- ggplot(dat2, aes(x = x, y = y)) + geom_point() + coord_equal()
cowplot::plot_grid(plot1, plot2, ncol = 1, align = "v")

image 2

I can force my objective by playing with and getting the rel_heights argument just right, but this is not a viable solution as I have many, dynamic plots to build. Here, the y-axes are aligned, and the coordinates of all axes are still equal.

cowplot::plot_grid(plot1, plot2, ncol = 1, align = "v", rel_heights = c(2, 1.07))

image 3

I've seen many approaches to similar questions that utilize ggplot2::ggplotGrob() and grid::grid_draw(), but nothing quite gets at this issues when coord_equal() is used. Perhaps the best solution doesn't use cowplot::plot_grid() at all, or perhaps the solution is somehow dynamically determining and passing the right values to rel_heights. I think I would prefer the later option so as to be able to easily use the other features that come with cowplot::plot_grid(). Perhaps some useful inspiration can be found in this related approach.

Saviour answered 22/2, 2018 at 9:48 Comment(6)
is egg::ggarrange(plot1, plot2) the sort of thing you want?Formicary
I tried egg::ggarrange(plot1, plot2, ncol = 1) and it does indeed do the vertical alignment, but the y-axis coordinates are not maintained as equal to that of the x-axis. The y-axis gets stretched a bit in the top plot. Also, I can't seem to find egg on github anymore - worries me that it might not be maintained anymore.Saviour
that's a shame, but perhaps there are other functions in that package which help (it is a bit weird that it is not on github, but it is on cran )Formicary
Not every piece of software is developed on github. The maintainer of egg doesn't develop on github, but the library is well maintained at this time.Feudatory
@ClausWilke ; the slightly strange thing is that baptiste/egg was being developed on github (and there are many answers on SO installing it from github), but it has since been removed from github. huh gridExtra is also removed, so seems a change of approachFormicary
@Formicary Yes, looks like gridExtra was available on github until version 2.2.1 and then removed sometime before the version 2.3 release. Maybe it was turned into a private repository.Feudatory
F
1

Author of cowplot::plot_grid() here. It doesn't work when you're trying to align plots with specified aspect ratio, which you generate when using coord_equal(). The solution is to use either the egg library or the patchwork library. Patchwork is still in development but should be released to CRAN soon. In the mean time, you can install from github.

Here is a solution using egg. It seems to me that it works just fine.

library(ggplot2)
library(egg)

dat1 <- data.frame(x = rep(1:10, 2), y = 1:20)
dat2 <- data.frame(x = 1:10, y = 1:10)
plot1 <- ggplot(dat1, aes(x = x, y = y)) + geom_point() + coord_equal()
plot2 <- ggplot(dat2, aes(x = x, y = y)) + geom_point() + coord_equal()
ggarrange(plot1, plot2, ncol = 1)

enter image description here

Two minor issues I see are that (1) the axis ticks for the two y axes are different, and that makes it look like the spacing is different, and (2) the axes are expanded to different limits. You can work around both by manually setting ticks and expansion.

plot1 <- ggplot(dat1, aes(x = x, y = y)) + geom_point() + 
  scale_y_continuous(limits = c(0, 21), breaks = 5*(0:4), expand = c(0, 0)) +
  coord_equal()
plot2 <- ggplot(dat2, aes(x = x, y = y)) + geom_point() + 
  scale_y_continuous(limits = c(0, 11), breaks = 5*(0:4), expand = c(0, 0)) +
  coord_equal()
ggarrange(plot1, plot2, ncol = 1)

enter image description here

Feudatory answered 23/2, 2018 at 5:25 Comment(4)
Claus, thank you for reaffirming that egg::ggarrange() does in fact work. As you pointed out, what tricked me before into thinking that the axes were still not quite correct was that they were expanded differently. @user20650, I'm sorry I missed this and doubted your suggestion! HOWEVER, the egg::ggarrange() solution breaks down when faceting is included. Any suggestions for how to generalize this for faceting? I've updated the original question to reflect this.Saviour
Kevin, please don't keep adding complexity to this question by editing it. It's better to accept one of the answers here as correct for the original question and then post a new question for the more complex case (with faceting). The people who have answered already will not want to chase a moving target, and people who haven't seen the question yet are unlikely to see the edit either.Feudatory
Okay, got it. The new question is here: #48962427Saviour
Any idea why thos doesn't work when trying to align horizontally? I've asked a question here about it: #76428597Projectile
G
1

By default, the range of the axes actually extends a little bit past the limits in the ggplot. The expand argument in function scale_continuous/discrete() was used to setting the extends. As in the scale_continuous() documentation:

A numeric vector of length two giving multiplicative and additive expansion constants. These constants ensure that the data is placed some distance away from the axes. The defaults are c(0.05, 0) for continuous variables, and c(0, 0.6) for discrete variables.

library(ggplot2)
dat1 <- data.frame(x = rep(1:10, 2), y = 1:20)
dat2 <- data.frame(x = 1:10, y = 1:10)
plot1 <- ggplot(dat1, aes(x = x, y = y)) + geom_point() + coord_equal()
plot2 <- ggplot(dat2, aes(x = x, y = y)) + geom_point() + coord_equal()

Fist, we can calculate the actual heights of this two plots, this post explains how the expand argument work.

# The defaults are c(0.05, 0) for your continuous variables
limity1 <- max(dat1$y) - min(dat1$y)
y1 <- limity1 + 2 * limity1 * 0.05
limity2 <- max(dat2$y) - min(dat2$y)
y2 <- limity2 + 2 * limity2 * 0.05

Then, use patchwork to compose this two plots

library(patchwork)
#  actual heights of plots was used to set the heights argment
plot1 + plot2 + plot_layout(ncol = 1, heights = c(y1, y2))

enter image description here

Gauffer answered 23/2, 2018 at 3:19 Comment(0)
F
1

Author of cowplot::plot_grid() here. It doesn't work when you're trying to align plots with specified aspect ratio, which you generate when using coord_equal(). The solution is to use either the egg library or the patchwork library. Patchwork is still in development but should be released to CRAN soon. In the mean time, you can install from github.

Here is a solution using egg. It seems to me that it works just fine.

library(ggplot2)
library(egg)

dat1 <- data.frame(x = rep(1:10, 2), y = 1:20)
dat2 <- data.frame(x = 1:10, y = 1:10)
plot1 <- ggplot(dat1, aes(x = x, y = y)) + geom_point() + coord_equal()
plot2 <- ggplot(dat2, aes(x = x, y = y)) + geom_point() + coord_equal()
ggarrange(plot1, plot2, ncol = 1)

enter image description here

Two minor issues I see are that (1) the axis ticks for the two y axes are different, and that makes it look like the spacing is different, and (2) the axes are expanded to different limits. You can work around both by manually setting ticks and expansion.

plot1 <- ggplot(dat1, aes(x = x, y = y)) + geom_point() + 
  scale_y_continuous(limits = c(0, 21), breaks = 5*(0:4), expand = c(0, 0)) +
  coord_equal()
plot2 <- ggplot(dat2, aes(x = x, y = y)) + geom_point() + 
  scale_y_continuous(limits = c(0, 11), breaks = 5*(0:4), expand = c(0, 0)) +
  coord_equal()
ggarrange(plot1, plot2, ncol = 1)

enter image description here

Feudatory answered 23/2, 2018 at 5:25 Comment(4)
Claus, thank you for reaffirming that egg::ggarrange() does in fact work. As you pointed out, what tricked me before into thinking that the axes were still not quite correct was that they were expanded differently. @user20650, I'm sorry I missed this and doubted your suggestion! HOWEVER, the egg::ggarrange() solution breaks down when faceting is included. Any suggestions for how to generalize this for faceting? I've updated the original question to reflect this.Saviour
Kevin, please don't keep adding complexity to this question by editing it. It's better to accept one of the answers here as correct for the original question and then post a new question for the more complex case (with faceting). The people who have answered already will not want to chase a moving target, and people who haven't seen the question yet are unlikely to see the edit either.Feudatory
Okay, got it. The new question is here: #48962427Saviour
Any idea why thos doesn't work when trying to align horizontally? I've asked a question here about it: #76428597Projectile

© 2022 - 2025 — McMap. All rights reserved.