Kibana - How to extract fields from existing Kubernetes logs
Asked Answered
V

2

2

I have a sort of ELK stack, with fluentd instead of logstash, running as a DaemonSet on a Kubernetes cluster and sending all logs from all containers, in logstash format, to an Elasticsearch server.

Out of the many containers running on the Kubernetes cluster some are nginx containers which output logs of the following format:

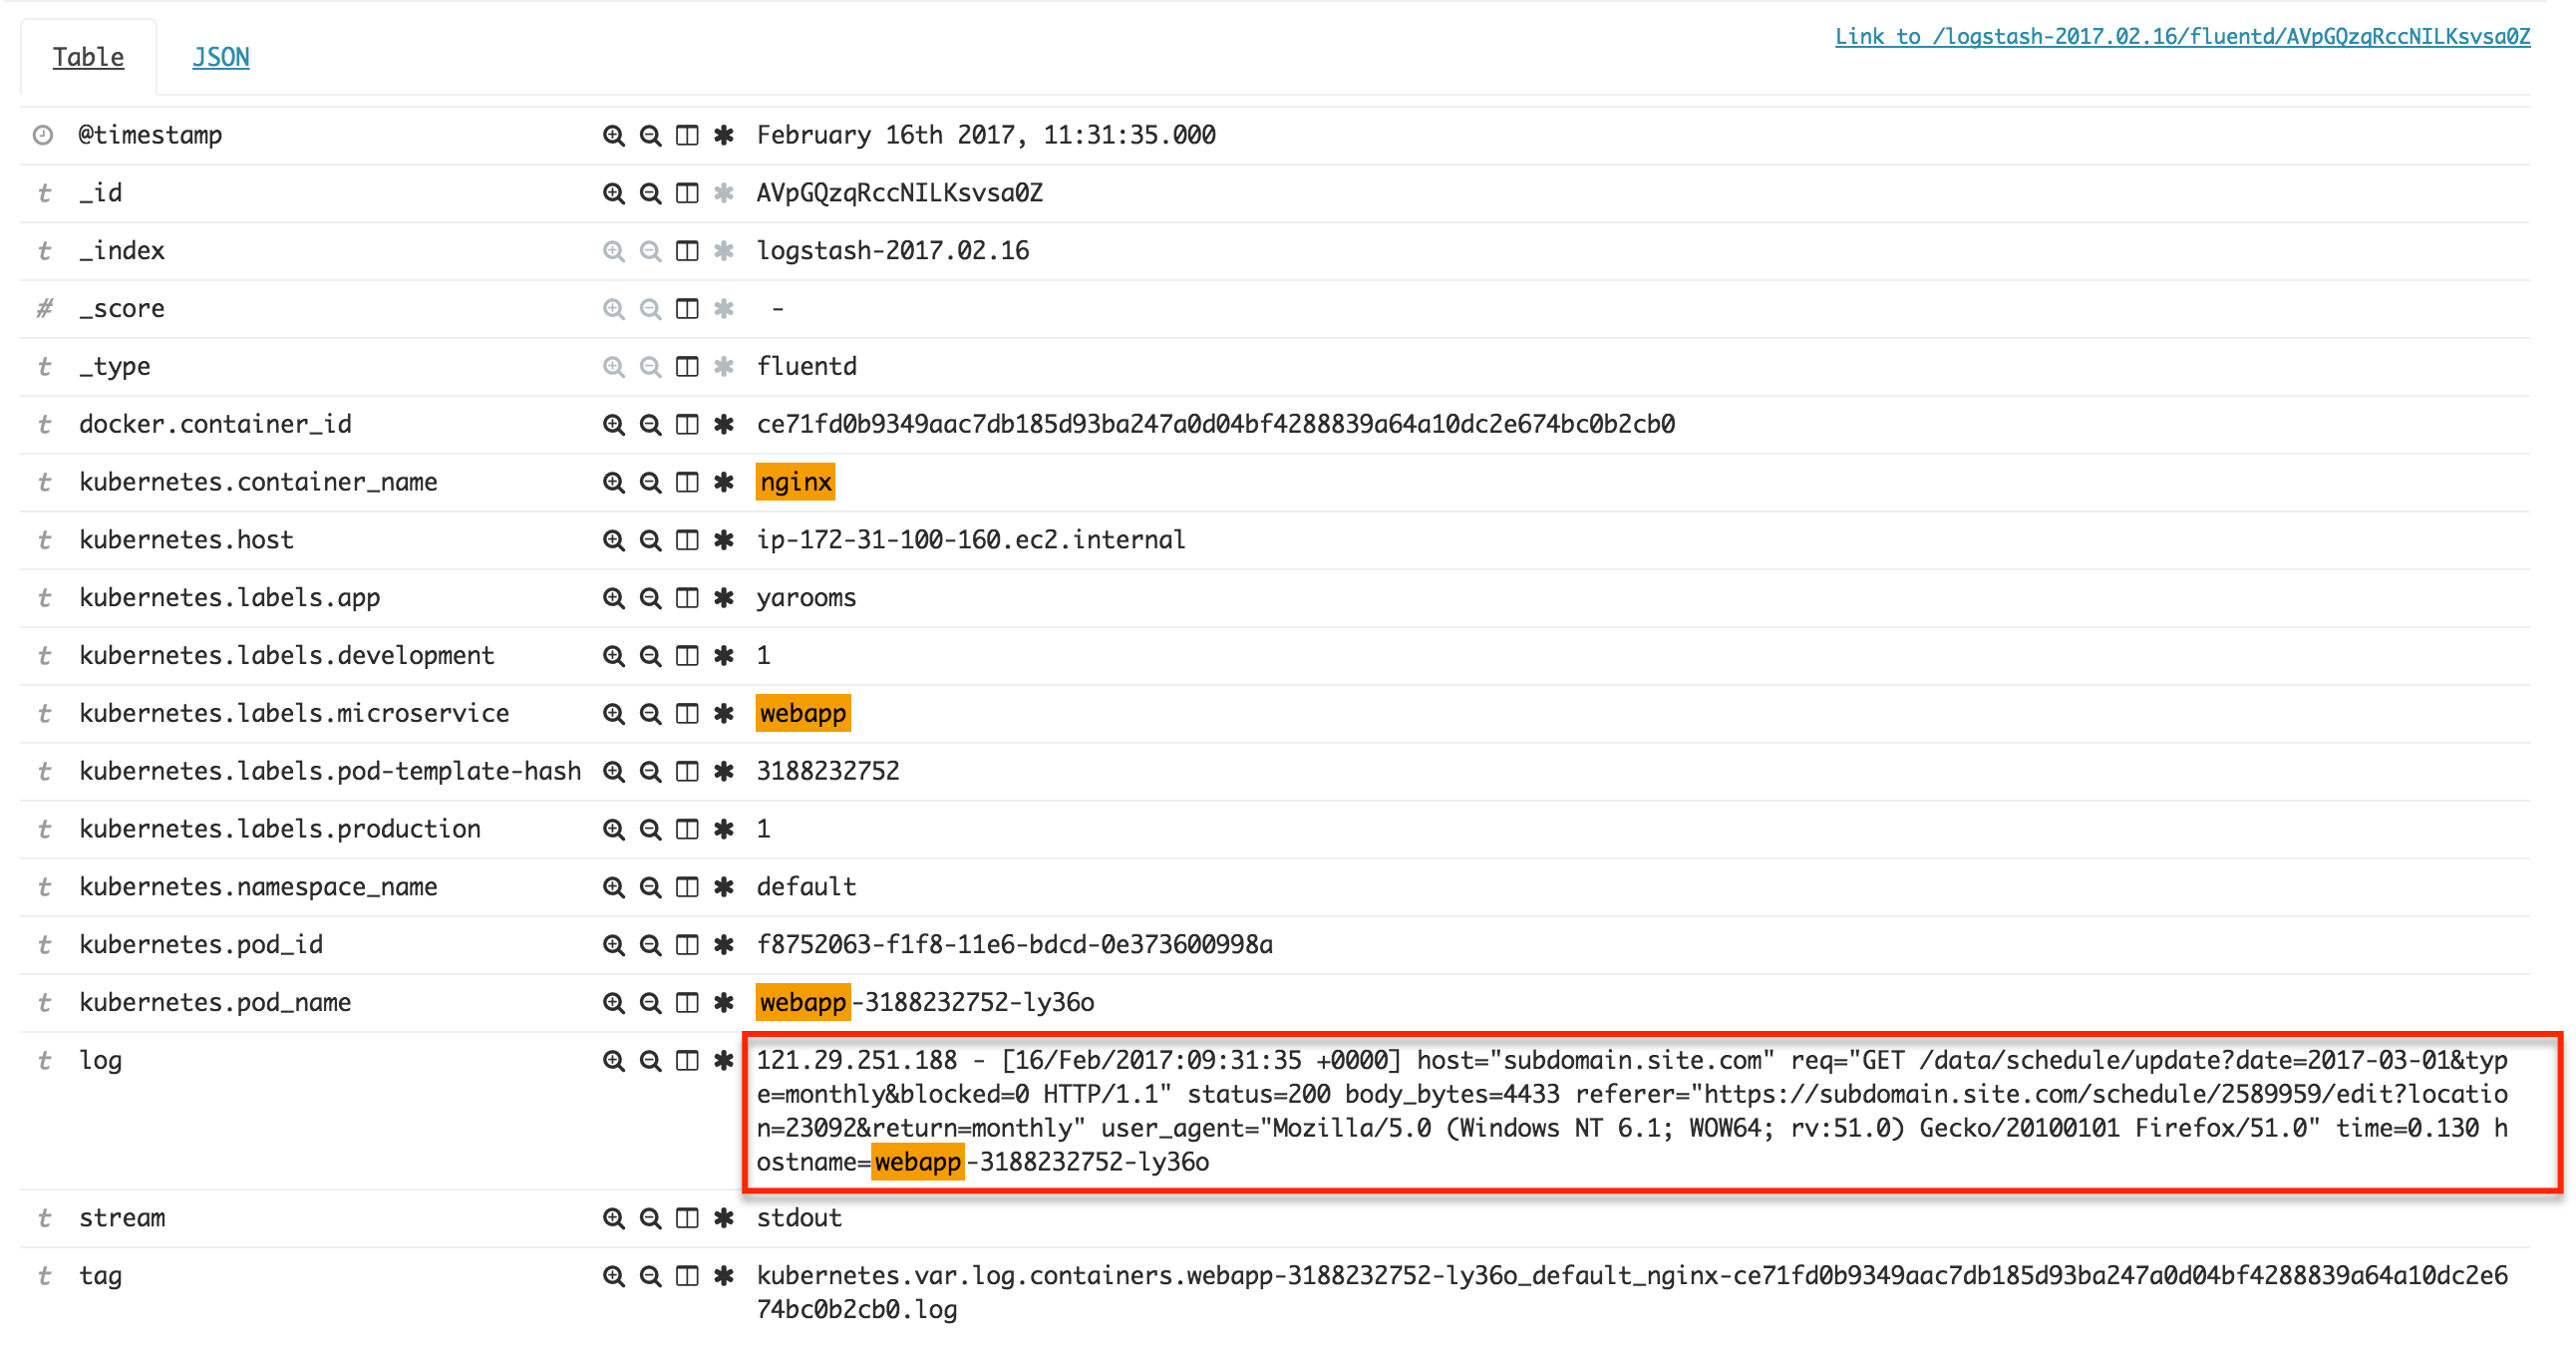
121.29.251.188 - [16/Feb/2017:09:31:35 +0000] host="subdomain.site.com" req="GET /data/schedule/update?date=2017-03-01&type=monthly&blocked=0 HTTP/1.1" status=200 body_bytes=4433 referer="https://subdomain.site.com/schedule/2589959/edit?location=23092&return=monthly" user_agent="Mozilla/5.0 (Windows NT 6.1; WOW64; rv:51.0) Gecko/20100101 Firefox/51.0" time=0.130 hostname=webapp-3188232752-ly36o

The fields visible in Kibana are as per this screenshot:

kibana nginx log

Is it possible to extract fields from this type of log after it was indexed?

The fluentd collector is configured with the following source, which handles all containers, so enforcing a format at this stage is not possible due to the very different outputs from different containers:

<source>
  type tail
  path /var/log/containers/*.log
  pos_file /var/log/es-containers.log.pos
  time_format %Y-%m-%dT%H:%M:%S.%NZ
  tag kubernetes.*
  format json
  read_from_head true
</source>

In an ideal situation, I would like to enrich the fields visible in the screenshot above with the meta-fields in the "log" field, like "host", "req", "status" etc.

Vonvona answered 16/2, 2017 at 10:2 Comment(0)
V
7

After a few days of research and getting accustomed to the EFK stack, I arrived to an EFK specific solution, as opposed to that in Darth_Vader's answer, which is only possible on the ELK stack.

So to summarize, I am using Fluentd instead of Logstash, so any grok solution would work if you also install the Fluentd Grok Plugin, which I decided not to do, because:

As it turns out, Fluentd has its own field extraction functionality through the use of parser filters. To solve the problem in my question, right before the <match **> line, so after the log line object was already enriched with kubernetes metadata fields and labels, I added the following:

<filter kubernetes.var.log.containers.webapp-**.log>
  type parser
  key_name log
  reserve_data yes
  format /^(?<ip>[^-]*) - \[(?<datetime>[^\]]*)\] host="(?<hostname>[^"]*)" req="(?<method>[^ ]*) (?<uri>[^ ]*) (?<http_version>[^"]*)" status=(?<status_code>[^ ]*) body_bytes=(?<body_bytes>[^ ]*) referer="(?<referer>[^"]*)" user_agent="(?<user_agent>[^"]*)" time=(?<req_time>[^ ]*)/
</filter>

To explain:

<filter kubernetes.var.log.containers.webapp-**.log> - apply the block on all the lines matching this label; in my case the containers of the web server component are called webapp-{something}

type parser - tells fluentd to apply a parser filter

key_name log - apply the pattern only on the log property of the log line, not the whole line, which is a json string

reserve_data yes - very important, if not specified the whole log line object is replaced by only the properties extracted from format, so if you already have other properties, like the ones added by the kubernetes_metadata filter, these are removed when not adding the reserve_data option

format - a regex that is applied on the value of the log key to extract named properties

Please note that I am using Fluentd 1.12, so this syntax is not fully compatible with the newer 1.14 syntax, but the principle will work with minor tweaks to the parser declaration.

Vonvona answered 19/2, 2017 at 17:12 Comment(3)
how can we do the same with fluent-bit?Semicentennial
@Vonvona Would you mind sharing your configmap and how this is setup? I had to update this a bit and have the filter correct using Fluentular and was able to validate it but it is not applying the filter to our logs. ThanksGignac
I also can use elasticsearch ingest nodeCuster
X
1

In order to extract a log line into fields, you might have to use the grok filter. What you can do is to have a regex pattern, to match the exact part of the log line you needed. Grok filter could look something like this:

grok {
    patterns_dir => ["pathto/patterns"]
    match => { "message" => "^%{LOGTIMESTAMP:logtimestamp}%{GREEDYDATA:data}" }         
}                                                 ^-----------------------^ are the fields you would see in ES when log is being indexed

----------------------------------------------------^ LOGTIMESTAMP should be defined in your patterns file something like:

LOGTIMESTAMP %{YEAR}%{MONTHNUM}%{MONTHDAY} %{TIME}

Once you have the matched fields, then you could simply use them for filtering purposes or you could still leave it as it is, if the main cause it to extract the fields from a log line.

if "something" in [message]{
     mutate {
         add_field => { "new_field" => %{logtimestamp} }
     }          
}

The above is just a sample so that you could reproduce it to suit your needs. You could use this tool, in order to test your patterns along with the string you wanted to match!

Blog post, could be handy! Hope this helps.

Xanthippe answered 16/2, 2017 at 10:18 Comment(1)
Thanks for the answer, @Darth_vader. I understand this can be done with logstash, but I'm using fluentd for log collection, please see the configuration in my question. Do you know how this could be done with fluentd out of the box?Vonvona

© 2022 - 2024 — McMap. All rights reserved.