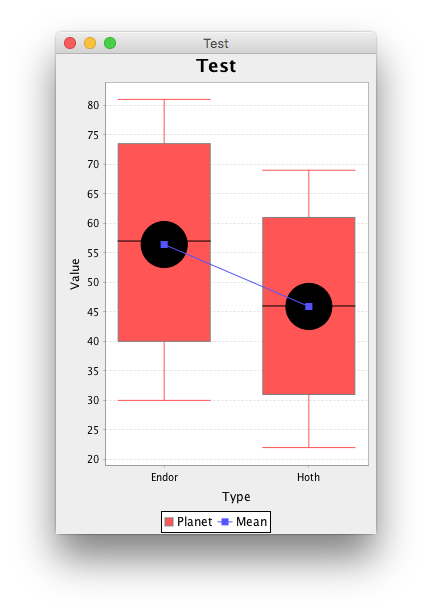
I have data that I'd like to represent as a box and whiskers graph, and have set up a category plot to do so. However, in addition, I'd like to add a line chart that shows an accumulation of the averages for each data point.
Right now my code is something like this
DefaultBoxAndWhiskerCategoryDataset dataSet = new DefaultBoxAndWhiskerCategoryDataset();
int i = 0;
for (List<Integer> categoryList : categoryLists) {
    dataSet.add(categoryList, i, "BoxAndWhiskers");
    i++;
}
BoxAndWhiskerRenderer renderer = new BoxAndWhiskerRenderer();

double sum = 0;
i = 0;
DefaultCategoryDataset averageDataSet = new DefaultCategoryDataset();
for (double average : averages) {
    sum += average;
    averageDataSet.add(sum, i, "Average");
    i++;
}
LineAndShapeRenderer lineAndShapeRenderer = new LineAndShapeRenderer();


CategoryAxis xAxis = new CategoryAxis("Type");
NumberAxis yAxis = new NumberAxis("Value");
CategoryPlot plot = new CategoryPlot(dataSet, xAxis, yAxis, renderer);

plot.setDataset(1, averageDataSet);
plot.setRenderer(1, lineAndShapeRenderer);

JFreeChart chart = new JFreeChart(
    "Box-and-Whisker",
    new Font("SansSerif", Font.BOLD, 14),
    plot,
    true
);

BufferedImage outputImage = chart.createBufferedImage(800, 600);

ImageIO.write(outputImage, "png", new File("output.png"));
However, when I look at my output.png, I only see the box and whiskers render (no lineandshape graph).
Is there something else I need to do to use both renderers and datasets in my output image? Additionally, is there a better approach to getting a cumuluative line for the averages in my box and whiskers graph?


averageDataSetby itself? – DiellarowKeyandcolumnKeyin the two datasetadd()invocations. – DiellarowKeyis a series and eachcolumnKeyis an element in the series, for example. – Diella