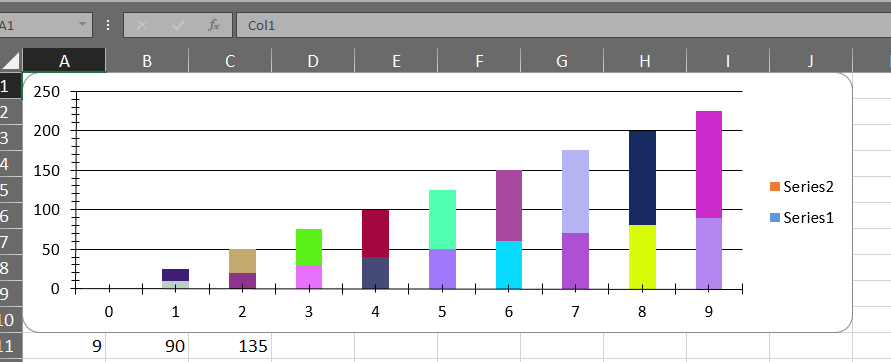
I am able to generate Column Stacked chart using EPPlus. There is is requirement to change the color of datapoint.
I found the solution of at enter link description here but it only changes the color of first datapoint of the series. Can I get help to change the color of other datapoints as well. Here is the concept that I am looking for enter image description here
Here is the function that helps to change datapoint first color
    public void SetDataPointStyle(OfficeOpenXml.Drawing.Chart.ExcelChart chart, ExcelChartSerie series, int totalDataPoint, Color color)
{
    var i = 0;
    var found = false;
    foreach (var s in chart.Series)
    {
        if (s == series)
        {
            found = true;
            break;
        }
        ++i;
    }
    if (!found) throw new InvalidOperationException("series not found.");

    var nsm = chart.WorkSheet.Drawings.NameSpaceManager;
    var nschart = nsm.LookupNamespace("c");
    var nsa = nsm.LookupNamespace("a");
    var node = chart.ChartXml.SelectSingleNode(@"c:chartSpace/c:chart/c:plotArea/c:barChart/c:ser[c:idx[@val='" + i.ToString(System.Globalization.CultureInfo.InvariantCulture) + "']]", nsm);
    var doc = chart.ChartXml;

    var spPr = doc.CreateElement("c:spPr", nschart);
    var solidFill = spPr.AppendChild(doc.CreateElement("a:solidFill", nsa));
    var srgbClr = solidFill.AppendChild(doc.CreateElement("a:srgbClr", nsa));
    var valattrib = srgbClr.Attributes.Append(doc.CreateAttribute("val"));
    valattrib.Value = ToHex(color).Substring(1);

    //var ln = spPr.AppendChild(doc.CreateElement("a:ln", nsa));
    //var lnSolidFill = ln.AppendChild(doc.CreateElement("a:solidFill", nsa));
    //var lnSrgbClr = lnSolidFill.AppendChild(doc.CreateElement("a:srgbClr", nsa));
    //var lnValattrib = lnSrgbClr.Attributes.Append(doc.CreateAttribute("val"));
    //lnValattrib.Value = ToHex(Color.Gray).Substring(1);

    node.AppendChild(spPr);
}
public String ToHex(Color c)
{
    return "#" + c.R.ToString("X2") + c.G.ToString("X2") + c.B.ToString("X2");
}
SetDataPointStyle(chart, chart.Series[0], 1, Color.Tan);

