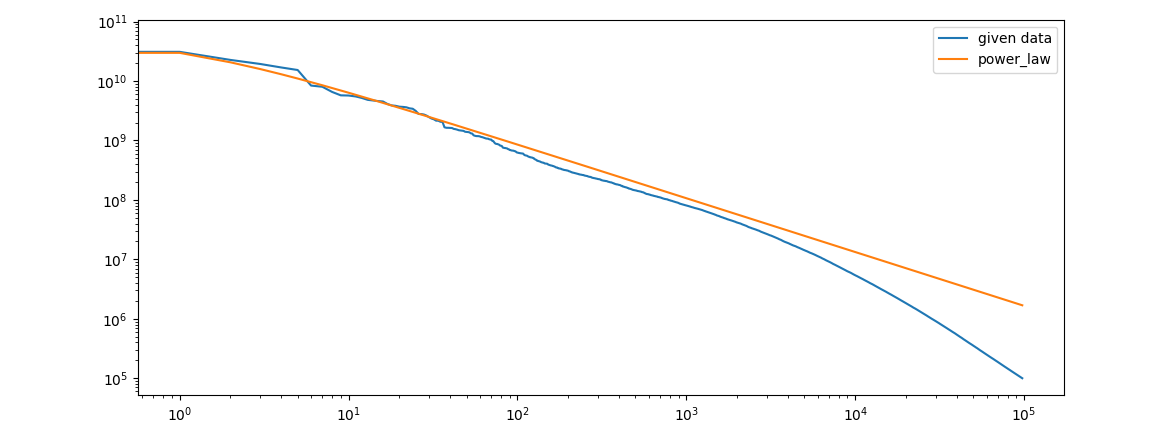
I have two data sets index_list and frequency_list which I plot in a loglog plot by plt.loglog(index_list, freq_list). Now I'm trying to fit a power law a*x^(-b) with linear regression. I expect the curve to follow the initial curve closely but the following code seems to output a similar curve but mirrored on the y-axis.
I suspect I am using curve_fit badly.
why is this curve mirrored on the x-axis and how I can get it to properly fit my inital curve?
import numpy as np
import matplotlib.pyplot as plt
from scipy.optimize import curve_fit

f = open ("input.txt", "r")
index_list = []
freq_list = []
index = 0
for line in f:
    split_line = line.split()
    freq_list.append(int(split_line[1]))
    index_list.append(index)
    index += 1

plt.loglog(index_list, freq_list)
def power_law(x, a, b):
    return a * np.power(x, -b)

popt, pcov = curve_fit(power_law, index_list, freq_list)
plt.plot(index_list,  power_law(freq_list, *popt))
plt.show()


y=xline – Publicy = a * x^btolog(y) = log(a) + b*log(x)and find solution withscipy.ptimize.leastsq- see xample in scipy-cookbook – Tomekatomes