Matlab Image Baseline (Offset Removal) Correction
Asked Answered
I

1

1

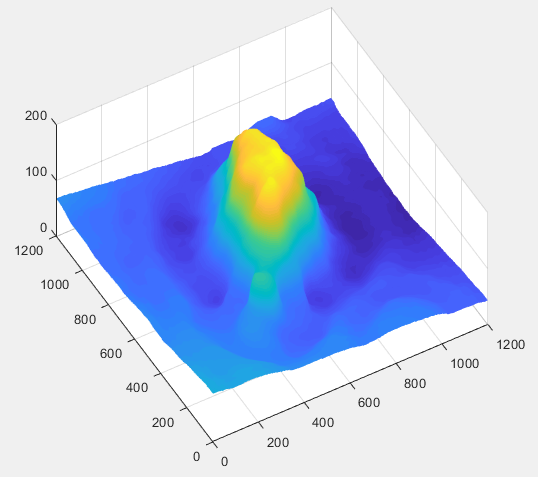
I have this plot:

enter image description here

and want to flatten its baseline/reduce offset using Matlab.

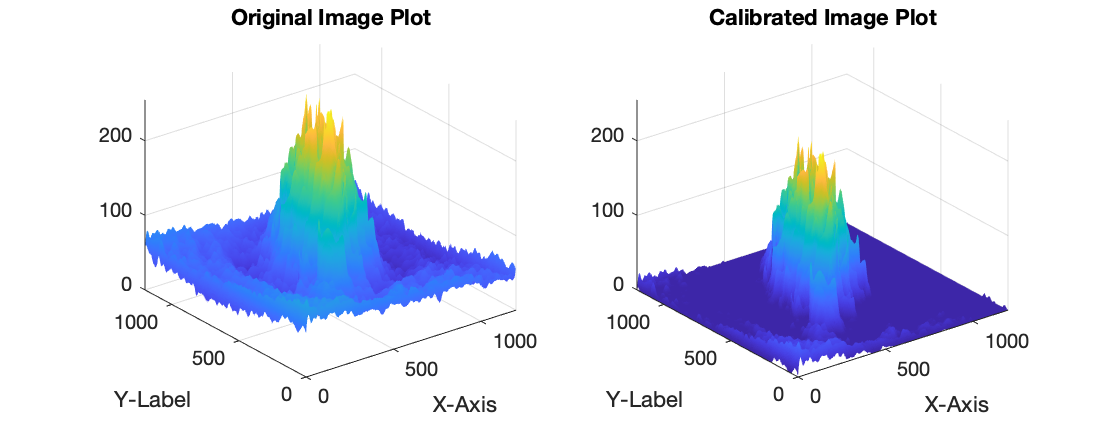
Basically like a baseline correction for a spectrum but here I've got a mesh and can't get my head around it how to flatten its baseline when dealing with a matrix? Basically the dot should stay but the surrounding is actually zero. The noise can stay, though.

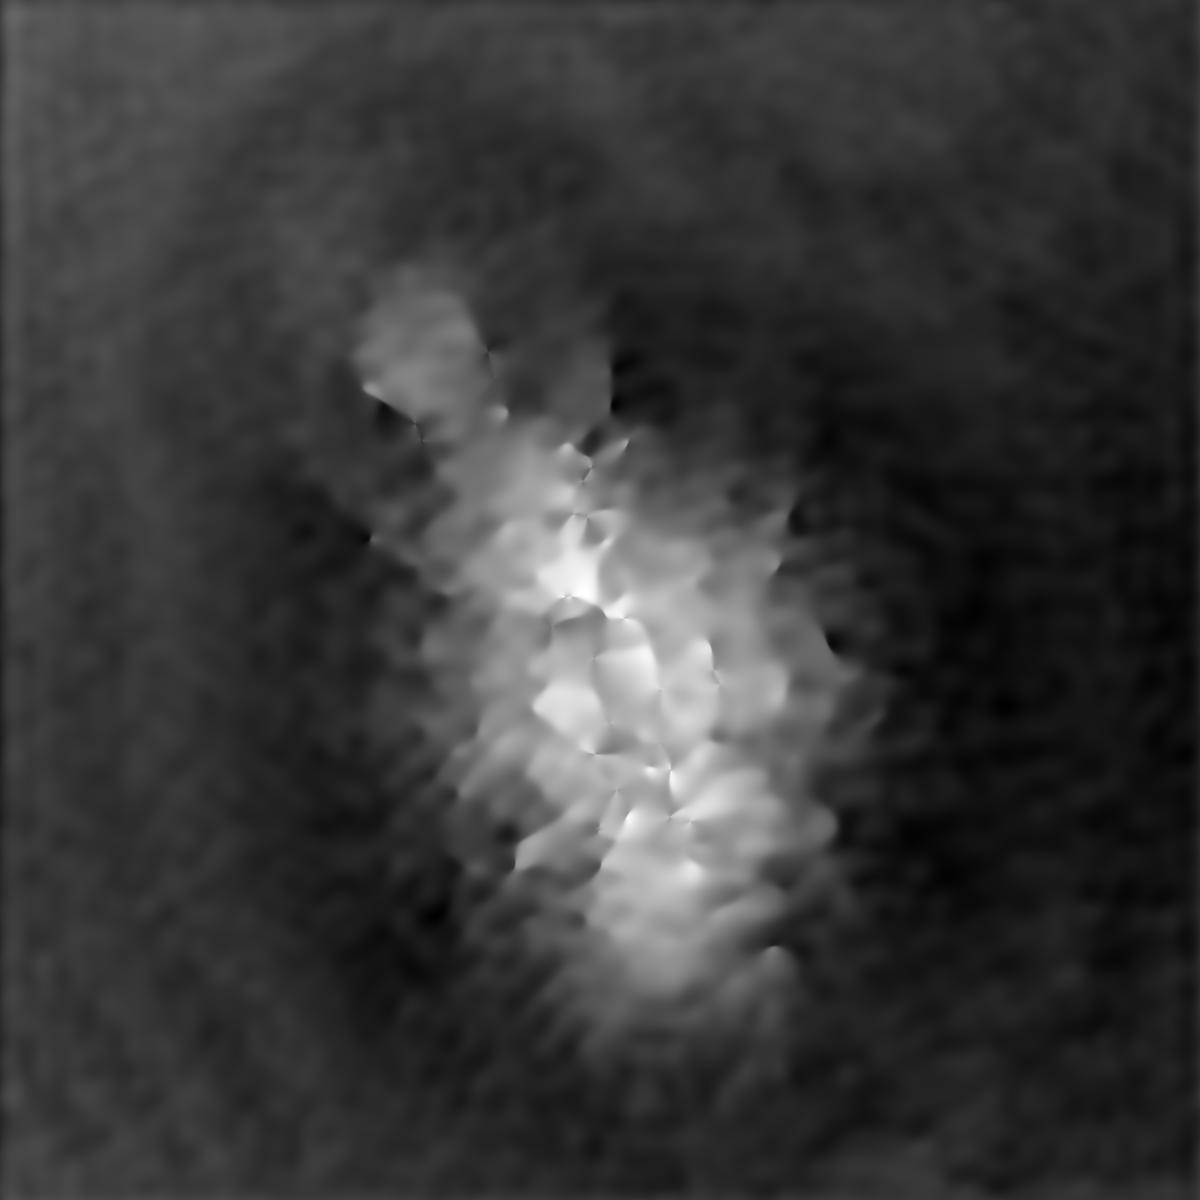
Here is the image:

enter image description here

I am wondering if something like this works:

        for x=1:1201
        for y=1:1201
             Ibasetest = polyfit(x,y,1);
        end
        end

Simply put do a baseline for each X along Y for Z data. But I can't get it to work. :(

Indurate answered 6/10, 2020 at 2:53 Comment(7)
How would you proceed with a simple signal? What baseline removal technical would you use? What is your input and what is the expected output?Growth
Just very basic. The dot in the middle should stay but I want to remove the offset around it. At the moment its like 10 to 60 offset. This should be pulled down to 0. Simple linear fit should do. Rest I can learn by playing around.Indurate
Would you happen to be willing to post the input image you used? That might make it easier to play around and test some methods.Cristinecristiona
Attached :) So basically the dark surrounding should be black. The noise can stay. I just want to remove the offset. Its not a constant offset across (that would be easy) but there's a tilt in the image baseline.Indurate
Oh, just noticed your comment. I'll try to accommodate the tilt and edit my answer.Cristinecristiona
@Indurate A few methods I can propose are filtering out the noise first, thresholding the image or doing a sliding/moving window average to estimate the amount of offset to remove for each point (pixel). I'm curious how involved of a method you're looking for.Cristinecristiona
Thanks @Cristinecristiona I already applied medfilt3(). Thats fine.Indurate
C
1

Note: Another method to attempt may include moving/windowing averages to calculate the local amount to offset by.

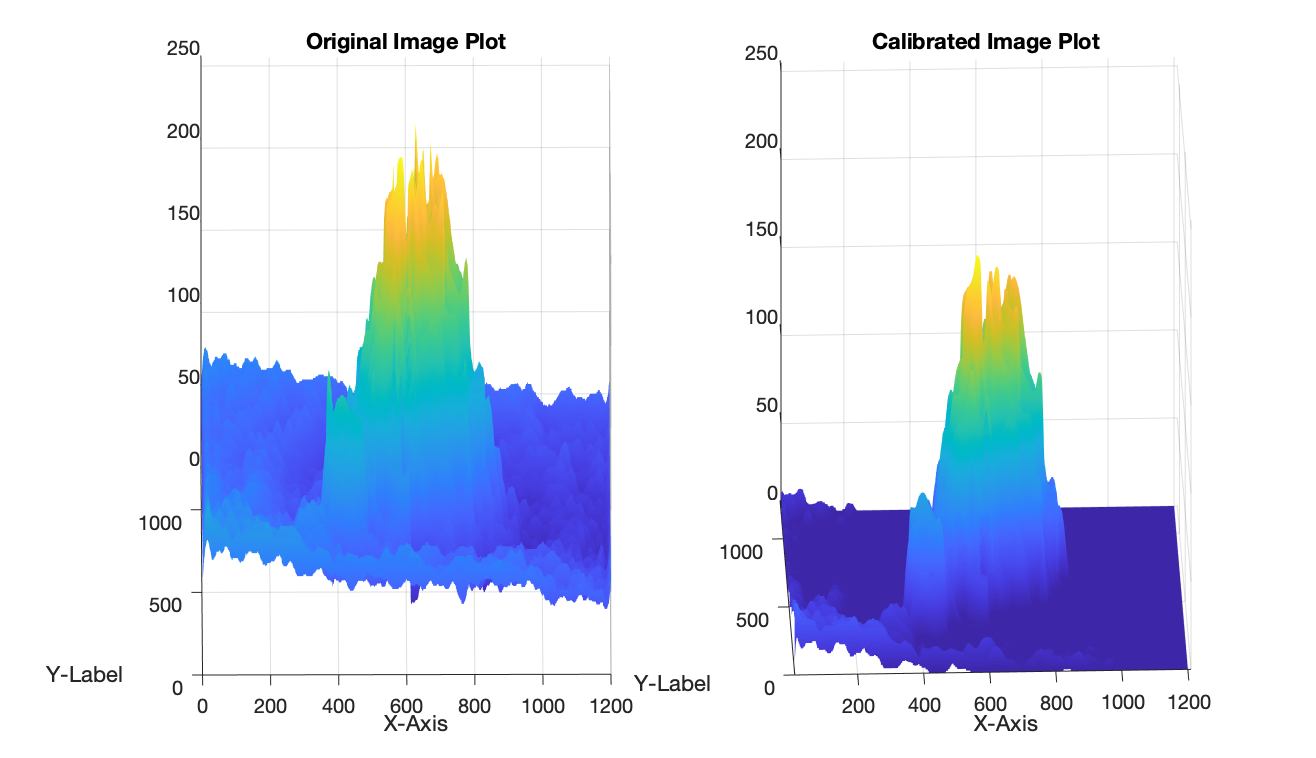
Method 1: Discrete Cosine Transform (DC Offset Removal)

Converts the image into the frequency domain uses the Discrete Fourier Transform (DCT). Removes the DC coefficient in the top-left corner (set to zero) of the matrix and convert it back to the spatial domain using the Inverse Discrete Fourier Transform (IDCT).

DC Removal 1

Image = imread("Test_Image.jpg");

%Converting image to greyscale if RGB image%
[Image_Height,Image_Width,Depth] = size(Image);
if(Depth == 3)
Image = rgb2gray(Image);
end

%Removing image offset%    
Discrete_Cosine_Transformed_Image = dct2(Image);
Discrete_Cosine_Transformed_Image(1,1) = 0;
Inverse_Discrete_Cosine_Transformed_Image = idct2(Discrete_Cosine_Transformed_Image);

Calibrated_Image = medfilt2(Inverse_Discrete_Cosine_Transformed_Image,[20 20]);

% Plotting the original and thresholded image%
X_Axes = (1:1:Image_Height);
Y_Axes = (1:1:Image_Width);

subplot(1,2,1); surf(X_Axes,Y_Axes,Image,'EdgeColor','none');
title("Original Image Plot");
xlabel('X-Axis'); ylabel('Y-Label');
zlim([0 255]);

subplot(1,2,2); surf(X_Axes,Y_Axes,uint8(Calibrated_Image),'EdgeColor','none');
title("Calibrated Image Plot");
xlabel('X-Axis'); ylabel('Y-Label');
zlim([0 255]);

Key Discrete Cosine Transform (DCT) Filtering Code Lines

%Removing image offset%    
Discrete_Cosine_Transformed_Image = dct2(Image);
Discrete_Cosine_Transformed_Image(1,1) = 0;
Inverse_Discrete_Cosine_Transformed_Image = idct2(Discrete_Cosine_Transformed_Image)

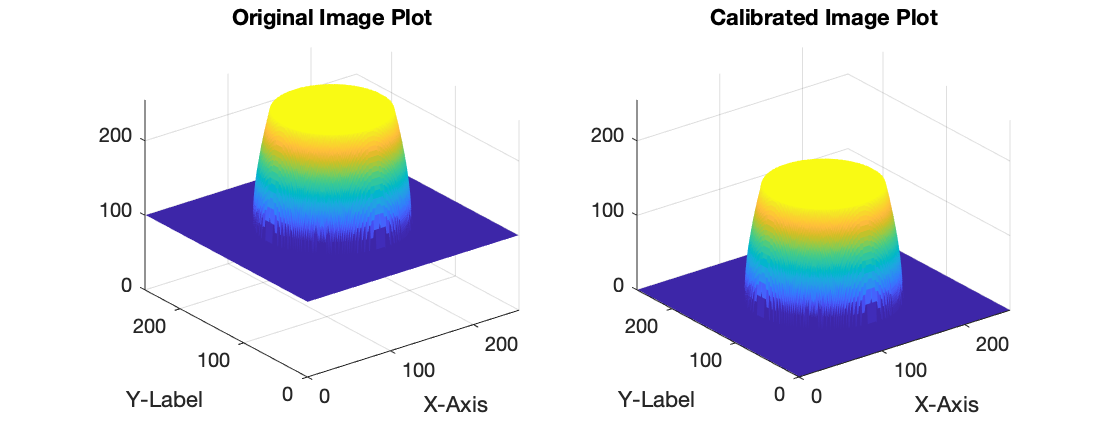
Method 2: Standard Uniform Offset (no-tilt accommodation)

Uses a constant value and subtracts that across the whole image matrix.

Test Image 1: Using Lowest Intensity to Calculate Offset

Offset Removal Image 1

Test Image 2: Using Average/Mean to Calculate Offset

Offset Removal Image 2

Image = imread("Circular_Image.png");

%Converting image to greyscale if RGB image%
[Image_Height,Image_Width,Depth] = size(Image);
if(Depth == 3)
Image = rgb2gray(Image);
end

   %Removing image offset%
Lowest_Intensity_Value = min(Image,[],'all');
Average = mean(Image,'all');
Calibrated_Image = Image - Average;

% Plotting the original and thresholded image%
X_Axes = (1:1:Image_Height);
Y_Axes = (1:1:Image_Width);

subplot(1,2,1); surf(X_Axes,Y_Axes,Image,'EdgeColor','none');
title("Original Image Plot");
xlabel('X-Axis'); ylabel('Y-Label');
zlim([0 255]);

subplot(1,2,2); surf(X_Axes,Y_Axes,Calibrated_Image,'EdgeColor','none');
title("Calibrated Image Plot");
xlabel('X-Axis'); ylabel('Y-Label');
zlim([0 255]);

Using MATLAB version: R2019b

Cristinecristiona answered 6/10, 2020 at 4:28 Comment(9)
Oh well. I was after a simple function removing the offset/baseline, even as linear regression. Super simple with line graphs but I cant get it done with 2D.Indurate
@Indurate Feel the same way on this one. I'll let you know if I find anything more concise and simple.Cristinecristiona
I tried with a loop that slices each X, Y and does a baseline subtraction matrix but didn't really work. % for x=1:1201 % for y=1:1201 % Ibasetest = polyfit(x,y,1); % end % end %Indurate
That's an interesting idea I'll have to look into.Cristinecristiona
I thought it gives a linear baseline for each X line along the Y direction. Basically Y = 1200 graphs having a line. Then this should be done for each Y in X direction, right? Then subtracting this from the actual image.Indurate
I forgot to mention this should be a simple method because I am processing 100 per second and more complex code is bad^^Indurate
That logic is correct. Hmm, not sure how well it would work. Might have a try myself. The biggest bottleneck I found is median filtering. The DCT portion is decently quick and 3 lines of code if that suffices.Cristinecristiona
Another idea: Smooth out entire plane across 300 pixel and use resulting 'image' as baseline?Indurate
That may work. But the speed may suffer depending on the smoothing method used.Cristinecristiona

© 2022 - 2024 — McMap. All rights reserved.