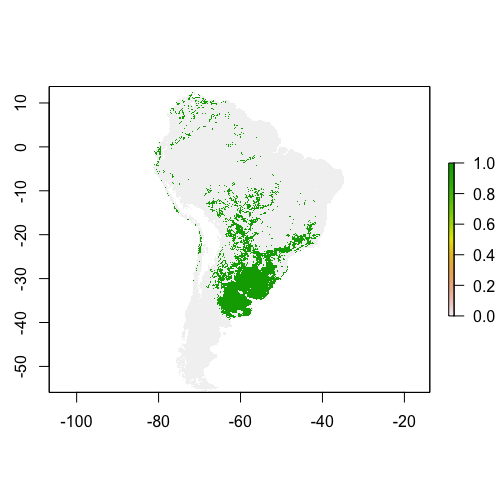
I have a list (s) containing information on the probable locations of many animals in South America. For example, this is the type of stored information and what it looks like when plotted for the first individual.
Example:
> s[1]
[[1]]
class       : RasterLayer
dimensions  : 418, 313, 130834  (nrow, ncol, ncell)
resolution  : 0.16666, 0.16666  (x, y)
extent      : -86.333, -34.16842, -55.91633, 13.74755  (xmin, xmax, ymin, ymax)
coord. ref. : NA
data source : in memory
names       : layer
values      : 0, 1  (min, max)
> plot(s[[1]])
Note: the green areas are all "likely" locations and the grey areas are "unlikely" locations.
I would like to calculate the centroid of this probable location (i.e., centroid of the green area).
Below @dww suggested the following solution (which works for the simulated data), but leads to an error message with my data.
colMeans(xyFromCell(s, which(s[]==1)))

Error in xyFromCell(s[1], which(s[] == 1)) :
trying to get slot "extent" from an object of a basic class ("list") with no slots


O O(two blobs with a gap in the middle), then the centroid is not in either blob. The centroid is not the most likely location. – Loggins