I am trying to profile a remote JVM with VisualVM 1.4. I am running macOS High Sierra 10.13.6 locally, with the following OpenJDK version:
java -version
openjdk version "1.8.0_181"
OpenJDK Runtime Environment (AdoptOpenJDK)(build 1.8.0_181-b13)
OpenJDK 64-Bit Server VM (AdoptOpenJDK)(build 25.181-b13, mixed mode)
The server runs Debian Stretch with the following OpenJDK:
java -version
openjdk version "1.8.0_181"
OpenJDK Runtime Environment (build 1.8.0_181-8u181-b13-2~deb9u1-b13)
OpenJDK 64-Bit Server VM (build 25.181-b13, mixed mode)
When I monitor a JVM process locally, I see all these tabs and the profiling works just fine.
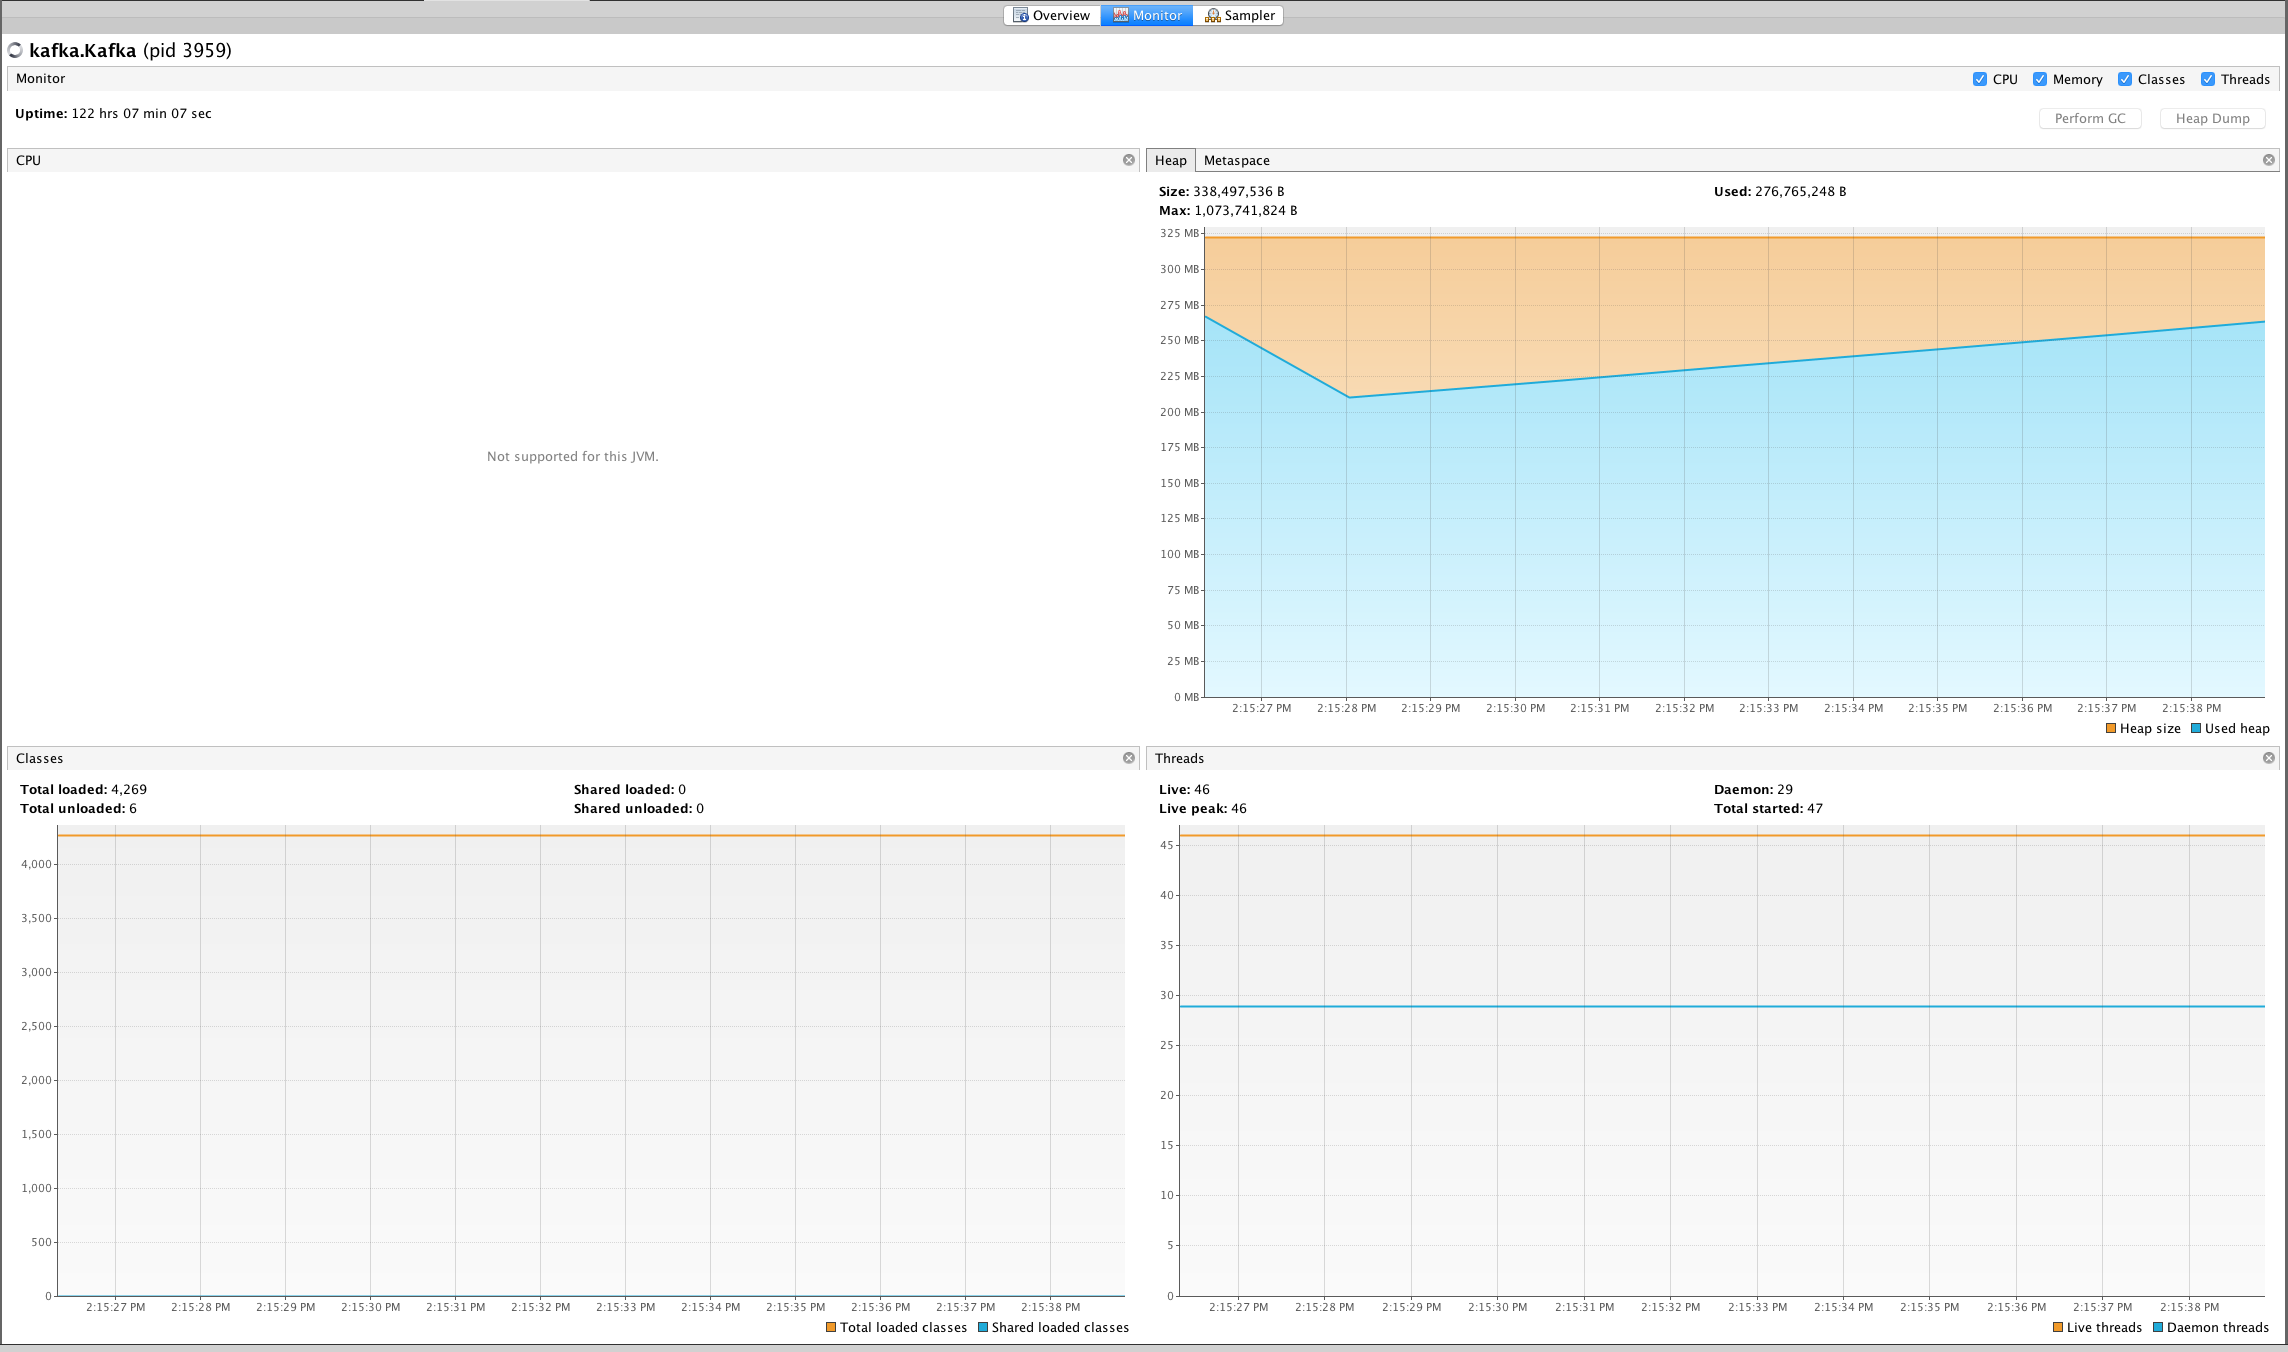
However, if I do that remotely, I see something like this:
Note the CPU window that says "Not supported for this JVM" and the reduced tabs, not including "Profiler". However, as you can see, I do see some data.
I am connecting via jstatd. On the server, following this article, I am running
jstatd -J-Djava.security.policy=/home/brandwatch/jstatd.all.policy -J-Djava.rmi.server.hostname=10.2.156.160 -Djava.rmi.server.logCalltrue
Answers like this indicate that this might be due to different JVM versions, however, mine appear to be the same, despite one of them running on MacOS and one of them on Debian.


