How to print or cat text into pdf() in R without markdown
Asked Answered
B

2

6

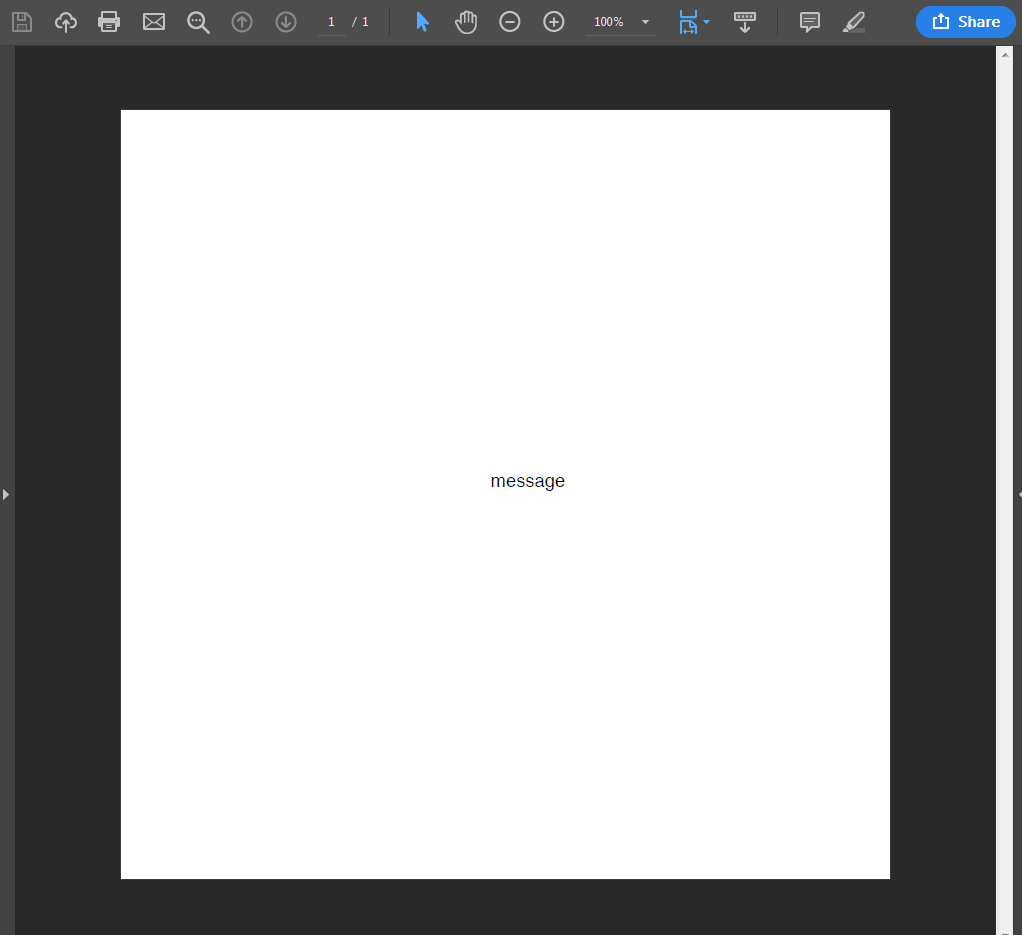
I'm creating a PDF file with some plots, but I want to also include some text message at the bottom. For reasons beyond my control, I cannot install a latex distribution on this system, so I can't knit a markdown file, but have to use pdf().

When I just use print or cat nothing shows up in the pdf. I tried using sink() based on the answer from here, but that didn't work either:

pdf("filename.pdf")
sink("filename.pdf")
print("message")
sink()
dev.off()

No error message was received, but the file created has no pages.

Any ideas? I'm considering a workaround of just plotting a text only plot, but I'm hoping there's a more reasonable solution.

Buckwheat answered 28/6, 2019 at 15:16 Comment(4)
Can this be related or this?Vasos
@PoGibas yeah, that looks like my planned workaround solution - creating a plot and just populating it with text.Buckwheat
I'm guessing you have other things going on with your system and latex, but I just thought I'd mention that one of the things I've liked about tinytex is that it can be installed even without admin privileges.Pieplant
Can you install any software? If you can install pandoc (or numerous other utilities that convert html to pdf) write your report out as html and then convert it. In particular check whether you already have such a utility.Orelia
A
4

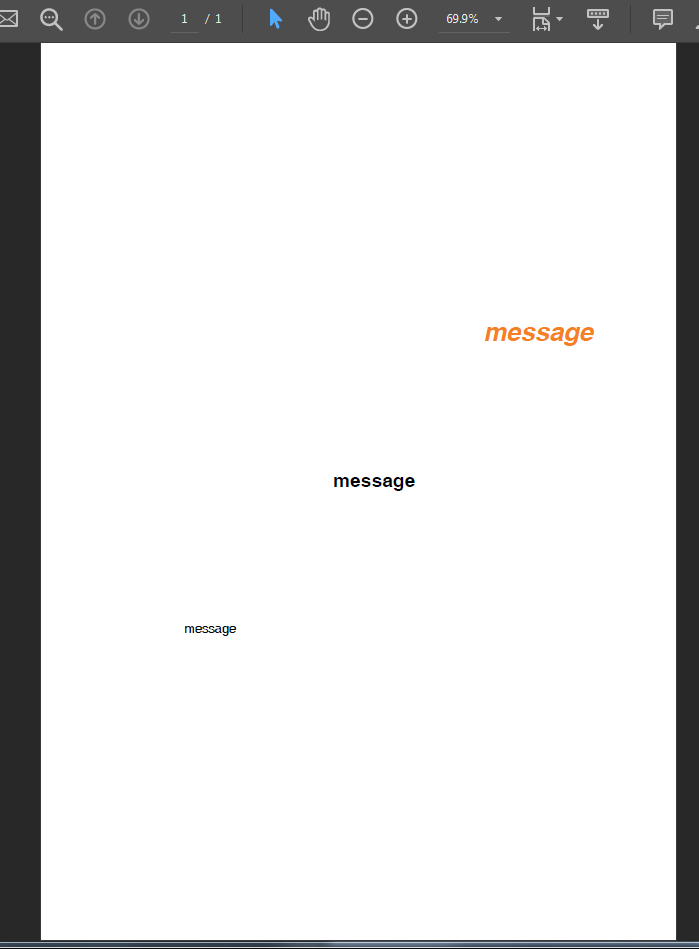
We simply could plot the text with text in pdf device. text only works after a plot call. That we don't have to deactivate everything, we call plot.new which is basically an empty plot. Look into ?pdf and ?text options for further customizing.

txt <- "message"

pdf("filename2.pdf", paper="a4")
plot.new()
text(x=.1, y=.1, txt)  # first 2 numbers are xy-coordinates within [0, 1]
text(.5, .5, txt, font=2, cex=1.5)
text(.9, .9, txt, font=4, cex=2, col="#F48024")
dev.off()

enter image description here

For the sink solution rather use cat and add a carriage return \r at the very end of the text to obtain a valid last line for pdf processing of the .txt file.

sink("filename.txt")  # to be found in dir `getwd()`
cat("message\r")
sink()

pdf("filename.pdf")  # ditto
plot.new()
text(.5, .5, readLines("filename.txt"))
dev.off()

Customize with different x and y coordinates, font options, and paper formatting in pdf call.

Result

enter image description here

Airline answered 28/6, 2019 at 16:24 Comment(6)
Why do we need the whole sink() part? Can't I just put the text directly into the plot?Buckwheat
@Buckwheat You started with sink. Probably this is possible, just replace readLines("filename.txt") with "message". sink is designed to direct console output in to a .txt file, I got the impression you wanted something like this.Airline
I tried with sink because I came across an answer that suggested I could use it. No reason to use it if it's not necessary.Buckwheat
Thanks. This is pretty much what I was planning on doing, was hoping for a simpler solution. Appreciate the detailed guide.Buckwheat
@Airline Hi, wondering how can we create a new page?Tartuffe
@MathAvengers Another plot.new();text(...) will create a new page. Use dev.off() just once at the very end.Airline
A
0

I had success solving this problem (PDFs only and R/RStudio but not RMarkdown) by using the package qpdf, specifically the pdf_overlay_stamp() function.

#Set WD
setwd("INSERT PATH FOR DESIRED INPUT FILES AND OUTPUT FILE")

#Generate Sample Files
pdf("Part1.pdf", width = 8.5, height = 11)
plot.new()
text(x = 0.35, y = 1, adj = c(0,1), labels = "This is Part1.pdf")
dev.off()

pdf("Part2.pdf", width = 8.5, height = 11)
plot.new()
text(x = 0.35, y = 0.5, adj = c(0,1), labels = "This is Part2.pdf")
dev.off()

#Identify files to overlay
f1 <- "Part1.pdf"
f2 <- "Part2.pdf"

#Overlay Text
qpdf::pdf_overlay_stamp(input = f1, stamp = f2)

If you already have source PDFs just substitute f1 and f2 for the file names of the base file and the stamp/watermark that you wish to overlay onto the base file.

Please note that pdf_overlay_stamp() pulls all pages from the f1/input file but only the 1st page from f2/stamp file.

You will need to change the x and y values for the plot for the "Part1.pdf" to change the placement of your desired text.

Abstractionism answered 20/12, 2022 at 20:21 Comment(0)

© 2022 - 2024 — McMap. All rights reserved.