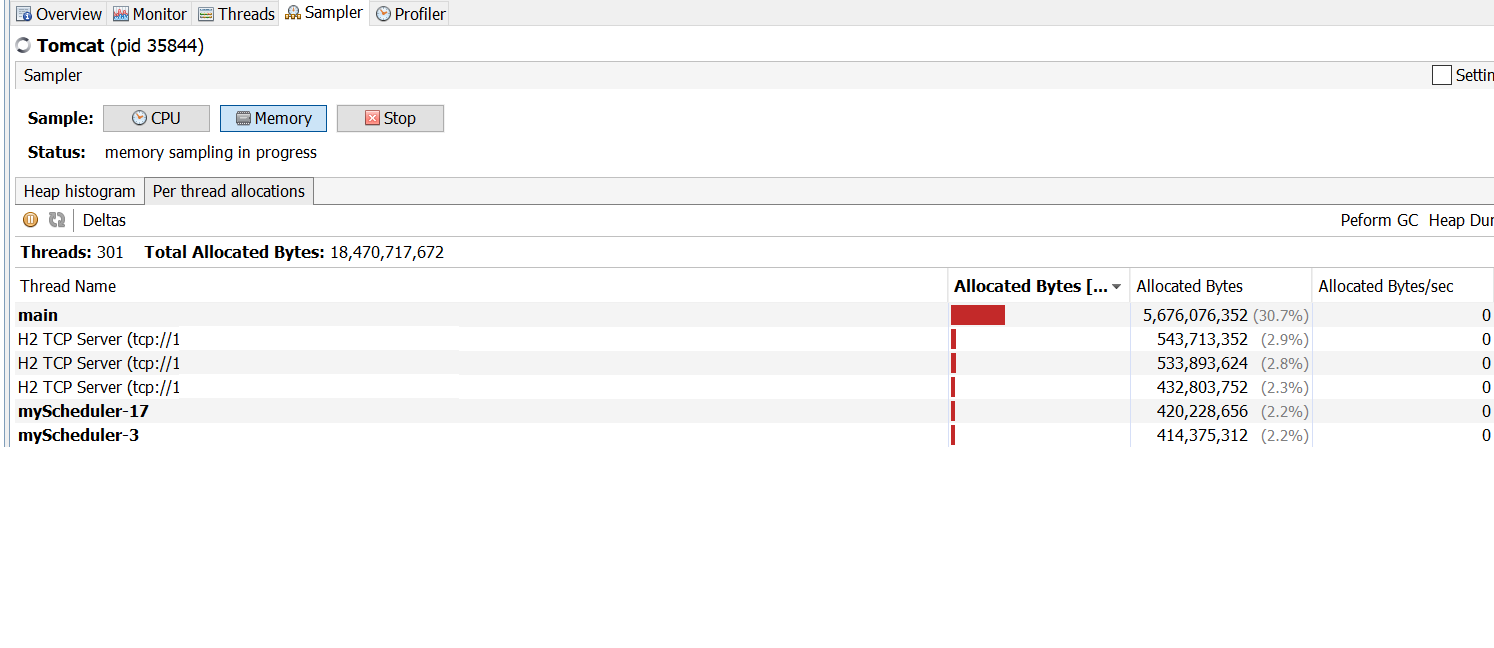
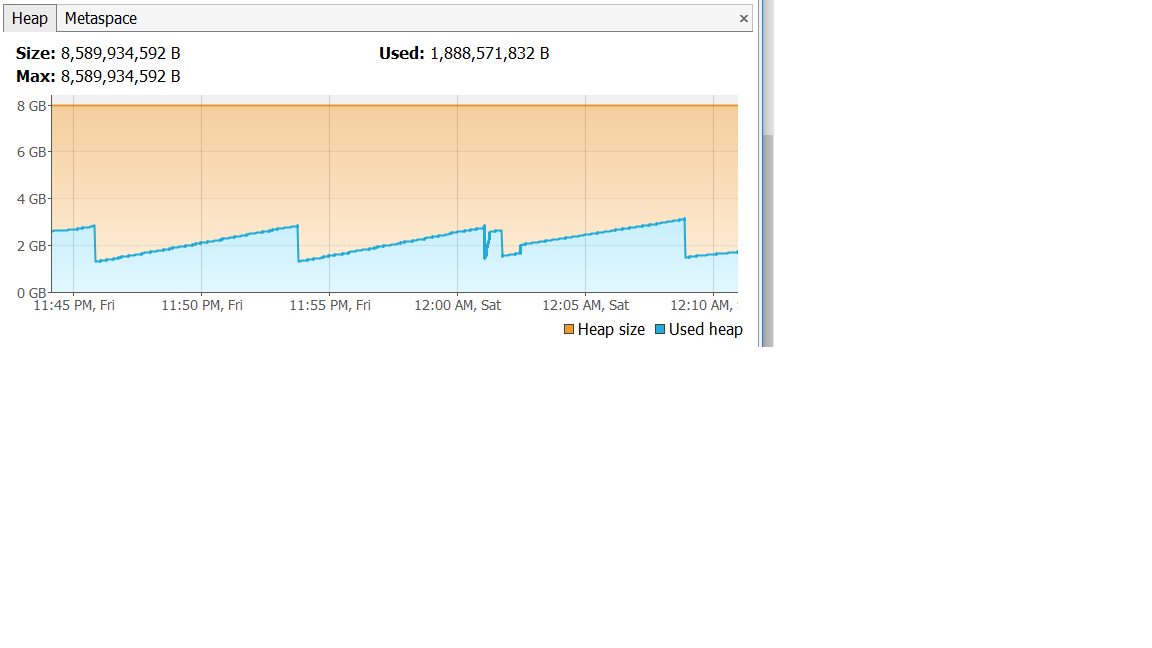
I have conected tomcat(8GB heap memory is allocated) to visualvm. In visualvm, Under the tab sampler -> memory , Total allocated memory is shown as 17GB(18470717672 bytes). But only 8GB is allocated for tomcat heap memory. In monitor tab its showing the allocated heap size as 8GB (8589934592 bytes) correctly. Please clarify why Total allocated memory is shown as 17GB in sampler tab?
What is total allocated memory in visualvm sampler
Total allocated memory in sampler shows how much memory was allocated for objects created during your sampling. Some of those objects were already garbage collected and no longer use any memory.
Used shows how much heap memory is currently occupied by objects which were allocated but have not yet been garbage collected.
Size shows how much heap memory is allocated to JVM. This space can be immediately used to allocate new objects.
Max shows how much Size can grow. JVM will not request more memory from operating system. It will throw OutOfMemoryError if new objects "do not fit".
Thanks. What is the difference between allocated byte & Allocated bytes per second in the tab Per thread allocation -> Sampler? I don't think the allocated bytes shown for each thread includes the memory which is already garbage collected. Becuase after some time, threads shown in the the tab Per thread allocation byte got disappeared. –
Merchandise
© 2022 - 2024 — McMap. All rights reserved.


