Slowdowns of performance of ets select
Asked Answered
P

1

6

I did some tests around performance of selection from ets tables and noted weird behaviour. For example we have a simple ets table (without any specific options) which stores key/value - a random string and a number:

:ets.new(:table, [:named_table])

for _i <- 1..2000 do
    :ets.insert(:table, {:crypto.strong_rand_bytes(10) 
    |> Base.url_encode64 
    |> binary_part(0, 10), 100})
end

and one entry with known key:

:ets.insert(:table, {"test_string", 200})

Now there is simple stupid benchmark function which tries to select test_string from the ets table multiple times and to measure time of each selection:

test_fn = fn() ->
  Enum.map(Enum.to_list(1..10_000), fn(x) ->
    :timer.tc(fn() ->
      :ets.select(:table, [{{:'$1', :'$2'}, 
                           [{:'==', :'$1', "test_string"}], 
                           [:'$_']}])
    end)
  end) |> Enum.unzip
end

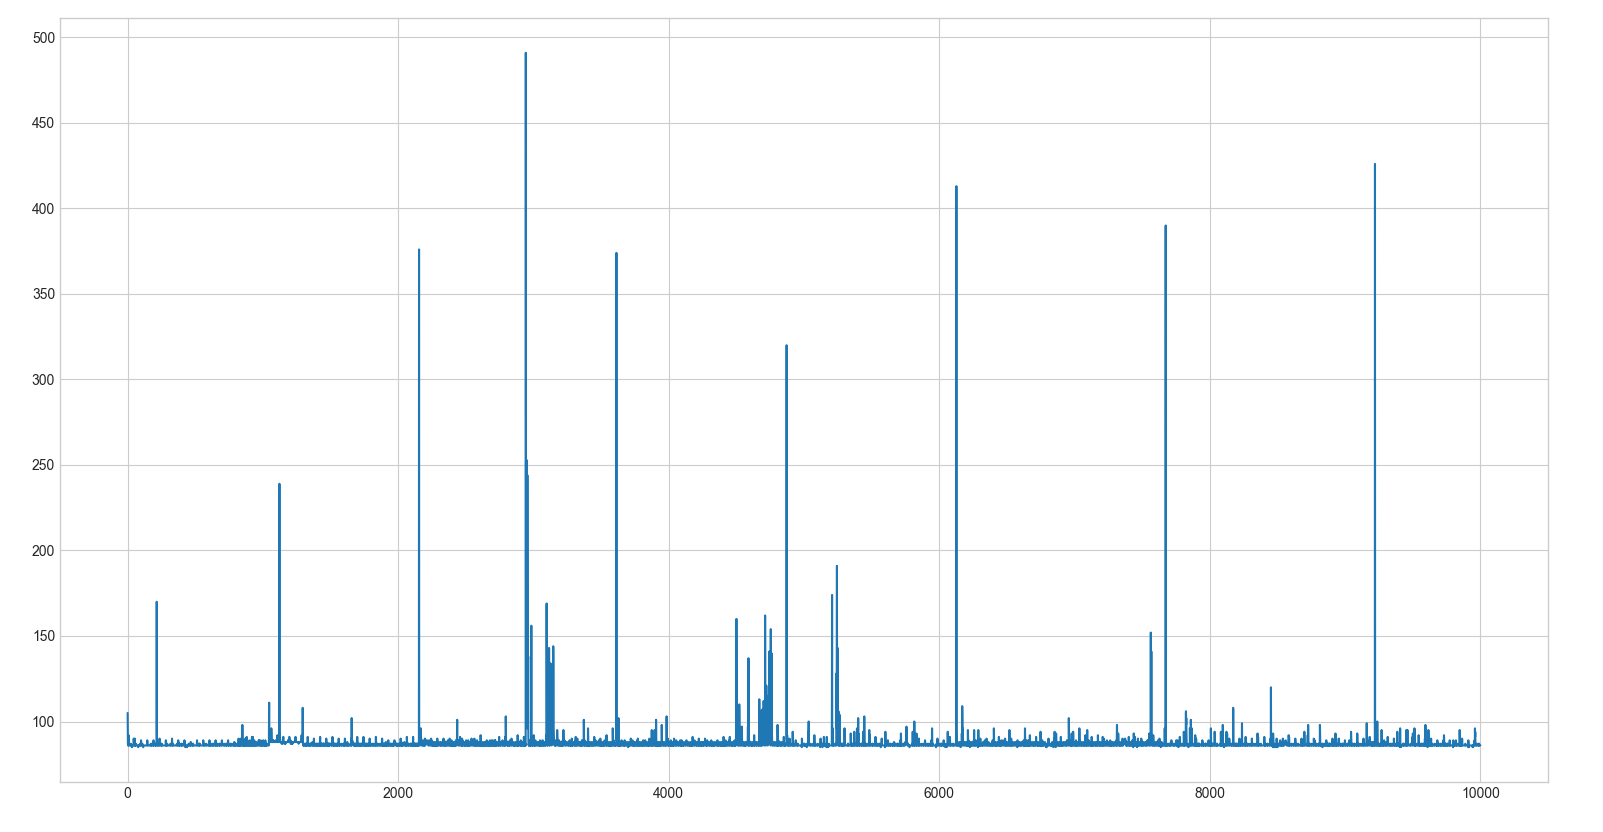
Now If I take a look at maximum time with Enum.max(timings) it will return a value which is approximately 10x times greater than almost of all other selections. So, for example:

iex(1)> {timings, _result} = test_fn.()
....
....
....
iex(2)> Enum.max(timings)
896
iex(3)> Enum.sum(timings) / length(timings)
96.8845

We may see here that maximum value is almost 10x times greater than average value.

What's happening here? Is it somehow related to GC, time for memory allocation or something like this? Do you have any ideas why selection from an ets table may give such slowdowns sometimes or how to profile this.

UPD.

here is the graph of timings distribution: enter image description here

Petulah answered 31/10, 2019 at 9:32 Comment(2)
Out of interest, which one is maximum value? Maybe you could plot the results and it will show some tendency.Collaborationist
added the graph of timing values distributionPetulah
D
4

match_spec, the 2nd argument of the select/2 is making it slower.

According to an answer on this question
Erlang: ets select and match performance

In trivial non-specific use-cases, select is just a lot of work around match.  
In non-trivial more common use-cases, select will give you what you really want a lot quicker.

Also, if you are working with tables with set or ordered_set type, to get a value based on a key, use lookup/2 instead, as it is lot faster.
On my pc, following code

  def lookup() do
    {timings, _} = Enum.map(Enum.to_list(1..10_000), fn(_x) ->
      :timer.tc(fn() ->
        :ets.lookup(:table, "test_string")
      end)
    end) |> Enum.unzip
    IO.puts Enum.max(timings)
    IO.puts Enum.sum(timings) / length(timings)
  end

printed

0 
0.0

While yours printed

16000
157.9

In case you are interested, here you can find the NIF C code for ets:select.
https://github.com/erlang/otp/blob/9d1b3bb0db87cf95cb821af01189f6d6be072f79/erts/emulator/beam/erl_db.c

Desideratum answered 5/11, 2019 at 14:3 Comment(2)
Thanks for the answer! My actual query is a little bit complex than I wrote here, that's why I'm using :ets.select/2 instead of :ets.lookup/2. Yes, I agree, select that :ets.select/2 does much stuff, especially when the second argument is given and it should be slower than lookup. But in the same time I'd expect that each select will take approximately the same amount of time, without such peaks as you may see on the graph.Petulah
I couldn't nail down exactly why, but it could be one of those. 1. NIF Myth (erlang.org/doc/efficiency_guide/myths.html ) 2. GC (since memory allocation on heap happens when you call ets:select.)Desideratum

© 2022 - 2024 — McMap. All rights reserved.