In the network dropdown after profiling a website the data is shown with thin white lines coming before and after the data. What do these thin white lines indicate?
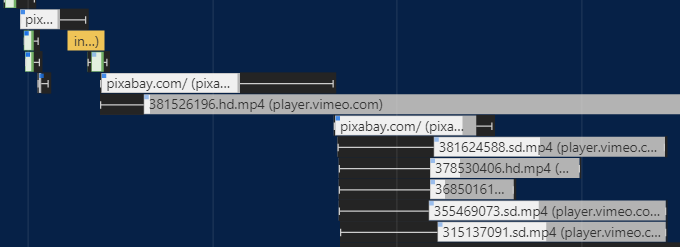
This data is interpreted using the axis on the top of the profiler and the color legend in the summary tab of the profiler output. Refer to this screenshot of a profile I took of this page for added clarity.
By looking near the top of the profile (immediately above the network profile dropdown ) you will see an axis that corresponds to the time since the start of the page request. Everything is measured in milliseconds (abbreviated "ms" in the profiler).
The left edge of the thin line on your requests represents the start time of the request to download the content named in the bar body. (Refer to the .mp4 bars in your image for clear depictions of the left edge of the referenced thin line)
Similarly, the right edge of the thin line on your requests represents the end time of a requested resource. This time includes any downloading, and loading/execution time.
The position of the bars tells you when each resource was loaded relative to the others in the profile and the start time.
The colors of the bars are depicted in the legend of the profile's summary tab (refer to my linked image for added clarity). At the time of writing:
- Loading is blue
- Scripting is orange
- Rendering is purple
- Painting is green
- System is grey
- Idle is white
If also helpful for you to visualize you can run this code snippet to see the colors more easily on StackOverflow:
.input-color {
  position: relative;
}

.input-color input {
  padding-left: 20px;
  background-color: #fff;
}

.input-color .color-box {
  width: 10px;
  height: 10px;
  display: inline-block;
  background-color: #8e8e8e;
  position: absolute;
  left: 5px;
  top: 5px;
}
<div class="input-color">
<input type="text" value="Loading (Blue)" readonly/>
<div class="color-box" style="background-color: #90b7e9;"></div>
</div>
<div class="input-color">
<input type="text" value="Scripting (Orange)" readonly/>
<div class="color-box" style="background-color: #f3d17c;"></div>
</div>
<div class="input-color">
<input type="text" value="Rendering (Purple)" readonly/>
<div class="color-box" style="background-color: #af99eb;"></div>
</div>
<div class="input-color">
<input type="text" value="Painting (Green)" readonly/>
<div class="color-box" style="background-color: #90c185;"></div>
</div>
<div class="input-color">
<input type="text" value="System (Grey)" readonly/>
<div class="color-box" style="background-color: #dedede;"></div>
</div>
<div class="input-color">
<input type="text" value="Idle (White)" readonly/>
<div class="color-box" style="background-color: #fafafa;"></div>
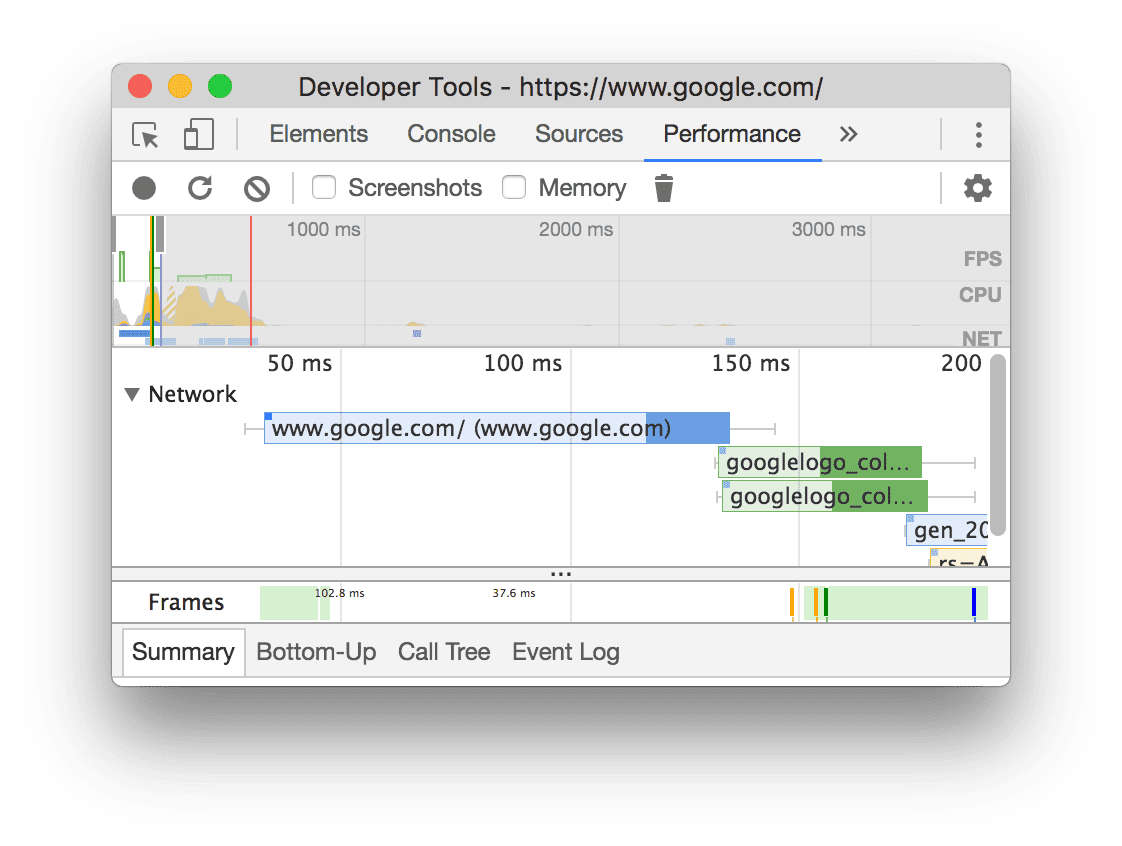
</div>Google has an official doc to explain this. reference: https://developer.chrome.com/docs/devtools/performance/reference/#network
TLDR:
Requests are color-coded as follows:
HTML: Blue CSS: Purple JS: Yellow Images: Green
Visualization meaning:
- The left line is everything up to the Connection Start group of events, inclusive. In other words, it's everything before Request Sent, exclusive.
- The light portion of the bar is Request Sent and Waiting (TTFB).
- The dark portion of the bar is Content Download.
- The right line is essentially time spent waiting for the main thread. This is not represented in the Timing tab.
© 2022 - 2024 — McMap. All rights reserved.


