As far as I can tell, this isn't easily achievable. There isn't anything in the user documentation or the Github documentation that suggests there's a parameter allowing you modify the proportion of each layer. However, it doesn't hurt to dig a bit deeper.
If we look at the following code example:
import plotly.express as px
data = dict(
    character=["Eve", "Cain", "Seth", "Enos", "Noam", "Abel", "Awan", "Enoch", "Azura"],
    parent=["", "Eve", "Eve", "Seth", "Seth", "Eve", "Eve", "Awan", "Eve" ],
    value=[10, 14, 12, 10, 2, 6, 6, 4, 4])

fig =px.sunburst(
    data,
    names='character',
    parents='parent',
    values='value'
)
If we run this Python code, and type in fig.layout.template.data, we can see what types of charts and the respective parameters being used to generate the sunburst chart:
layout.template.Data({
    'bar': [{'error_x': {'color': '#2a3f5f'},
             'error_y': {'color': '#2a3f5f'},
             'marker': {'line': {'color': '#E5ECF6', 'width': 0.5}},
             'type': 'bar'}],
    'barpolar': [{'marker': {'colorbar': {'len': 0.9, 'lenmode': 'fraction'}, 'line': {'color': '#E5ECF6', 'width': 0.5}},
                  'type': 'barpolar'}],
    'carpet': [{'aaxis': {'endlinecolor': '#2a3f5f',
                          'gridcolor': 'white',
                          'linecolor': 'white',
                          'minorgridcolor': 'white',
                          'startlinecolor': '#2a3f5f'},
                'baxis': {'endlinecolor': '#2a3f5f',
                          'gridcolor': 'white',
                          'linecolor': 'white',
                          'minorgridcolor': 'white',
                          'startlinecolor': '#2a3f5f'},
                'type': 'carpet'}],
    'choropleth': [{'colorbar': {'outlinewidth': 0, 'ticks': ''}, 'type': 'choropleth'}],
    'contour': [{'colorbar': {'outlinewidth': 0, 'ticks': ''},
                 'colorscale': [[0.0, '#0d0887'], [0.1111111111111111, '#46039f'],
                                [0.2222222222222222, '#7201a8'],
                                [0.3333333333333333, '#9c179e'],
                                [0.4444444444444444, '#bd3786'],
                                [0.5555555555555556, '#d8576b'],
                                [0.6666666666666666, '#ed7953'],
                                [0.7777777777777778, '#fb9f3a'],
                                [0.8888888888888888, '#fdca26'], [1.0, '#f0f921']],
                 'type': 'contour'}],
    'contourcarpet': [{'colorbar': {'outlinewidth': 0, 'ticks': ''}, 'type': 'contourcarpet'}],
    'heatmap': [{'colorbar': {'outlinewidth': 0, 'ticks': ''},
                 'colorscale': [[0.0, '#0d0887'], [0.1111111111111111, '#46039f'],
                                [0.2222222222222222, '#7201a8'],
                                [0.3333333333333333, '#9c179e'],
                                [0.4444444444444444, '#bd3786'],
                                [0.5555555555555556, '#d8576b'],
                                [0.6666666666666666, '#ed7953'],
                                [0.7777777777777778, '#fb9f3a'],
                                [0.8888888888888888, '#fdca26'], [1.0, '#f0f921']],
                 'type': 'heatmap'}],
    'heatmapgl': [{'colorbar': {'outlinewidth': 0, 'ticks': ''},
                   'colorscale': [[0.0, '#0d0887'], [0.1111111111111111,
                                  '#46039f'], [0.2222222222222222, '#7201a8'],
                                  [0.3333333333333333, '#9c179e'],
                                  [0.4444444444444444, '#bd3786'],
                                  [0.5555555555555556, '#d8576b'],
                                  [0.6666666666666666, '#ed7953'],
                                  [0.7777777777777778, '#fb9f3a'],
                                  [0.8888888888888888, '#fdca26'], [1.0,
                                  '#f0f921']],
                   'type': 'heatmapgl'}],
    'histogram': [{'marker': {'colorbar': {'outlinewidth': 0, 'ticks': ''}}, 'type': 'histogram'}],
    'histogram2d': [{'colorbar': {'outlinewidth': 0, 'ticks': ''},
                     'colorscale': [[0.0, '#0d0887'], [0.1111111111111111,
                                    '#46039f'], [0.2222222222222222, '#7201a8'],
                                    [0.3333333333333333, '#9c179e'],
                                    [0.4444444444444444, '#bd3786'],
                                    [0.5555555555555556, '#d8576b'],
                                    [0.6666666666666666, '#ed7953'],
                                    [0.7777777777777778, '#fb9f3a'],
                                    [0.8888888888888888, '#fdca26'], [1.0,
                                    '#f0f921']],
                     'type': 'histogram2d'}],
    'histogram2dcontour': [{'colorbar': {'outlinewidth': 0, 'ticks': ''},
                            'colorscale': [[0.0, '#0d0887'], [0.1111111111111111,
                                           '#46039f'], [0.2222222222222222,
                                           '#7201a8'], [0.3333333333333333,
                                           '#9c179e'], [0.4444444444444444,
                                           '#bd3786'], [0.5555555555555556,
                                           '#d8576b'], [0.6666666666666666,
                                           '#ed7953'], [0.7777777777777778,
                                           '#fb9f3a'], [0.8888888888888888,
                                           '#fdca26'], [1.0, '#f0f921']],
                            'type': 'histogram2dcontour'}],
    'mesh3d': [{'colorbar': {'outlinewidth': 0, 'ticks': ''}, 'type': 'mesh3d'}],
    'parcoords': [{'line': {'colorbar': {'outlinewidth': 0, 'ticks': ''}}, 'type': 'parcoords'}],
    'pie': [{'automargin': True, 'type': 'pie'}],
    'scatter': [{'marker': {'colorbar': {'outlinewidth': 0, 'ticks': ''}}, 'type': 'scatter'}],
    'scatter3d': [{'line': {'colorbar': {'outlinewidth': 0, 'ticks': ''}},
                   'marker': {'colorbar': {'outlinewidth': 0, 'ticks': ''}},
                   'type': 'scatter3d'}],
    'scattercarpet': [{'marker': {'colorbar': {'outlinewidth': 0, 'ticks': ''}}, 'type': 'scattercarpet'}],
    'scattergeo': [{'marker': {'colorbar': {'outlinewidth': 0, 'ticks': ''}}, 'type': 'scattergeo'}],
    'scattergl': [{'marker': {'colorbar': {'outlinewidth': 0, 'ticks': ''}}, 'type': 'scattergl'}],
    'scattermapbox': [{'marker': {'colorbar': {'outlinewidth': 0, 'ticks': ''}}, 'type': 'scattermapbox'}],
    'scatterpolar': [{'marker': {'colorbar': {'outlinewidth': 0, 'ticks': ''}}, 'type': 'scatterpolar'}],
    'scatterpolargl': [{'marker': {'colorbar': {'outlinewidth': 0, 'ticks': ''}}, 'type': 'scatterpolargl'}],
    'scatterternary': [{'marker': {'colorbar': {'outlinewidth': 0, 'ticks': ''}}, 'type': 'scatterternary'}],
    'surface': [{'colorbar': {'outlinewidth': 0, 'ticks': ''},
                 'colorscale': [[0.0, '#0d0887'], [0.1111111111111111, '#46039f'],
                                [0.2222222222222222, '#7201a8'],
                                [0.3333333333333333, '#9c179e'],
                                [0.4444444444444444, '#bd3786'],
                                [0.5555555555555556, '#d8576b'],
                                [0.6666666666666666, '#ed7953'],
                                [0.7777777777777778, '#fb9f3a'],
                                [0.8888888888888888, '#fdca26'], [1.0, '#f0f921']],
                 'type': 'surface'}],
    'table': [{'cells': {'fill': {'color': '#EBF0F8'}, 'line': {'color': 'white'}},
               'header': {'fill': {'color': '#C8D4E3'}, 'line': {'color': 'white'}},
               'type': 'table'}]
It's a bit messy, but from what I can tell, the sunburst chart is more or less built using a variety of other charts in Plotly including Barpolar and pie graph_objects.
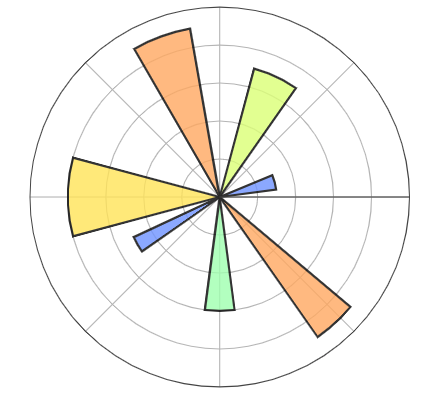
From the Plotly user documentation, a Barpolar graph_object looks like this:
![enter image description here]()
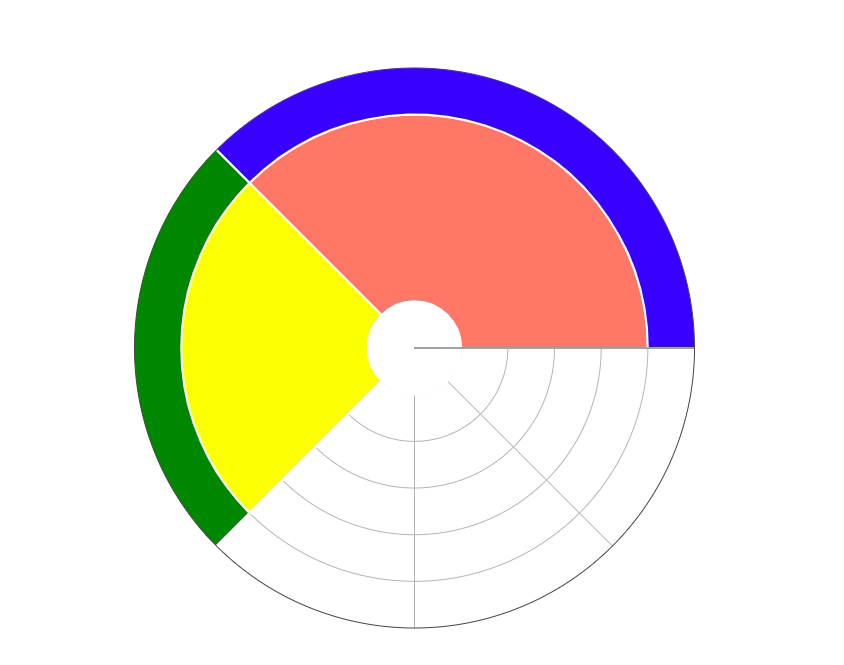
You can specify the radius of each bar, but they will all radiate outward from the origin by default. But if you really want to create the Sunburst chart with uneven layer thickness, and you're willing to work hard to do it, you can try to build it on top of the Barchart yourself: my suggestion would be to overlay colored bars over white bars and test out different radii for each bar. Here is an example of what you can realistically achieve:
import plotly.graph_objects as go

fig = go.Figure()

## create bars of larger radius beneath
fig.add_trace(go.Barpolar(
    r=[5, 5],
    theta=[67.5, 180],
    width=[135, 90],
    marker_color=["salmon","yellow"],
    marker_line_color="white",
    marker_line_width=2,
    opacity=1
    )
)

fig.add_trace(go.Barpolar(
    r=[2, 2],
    theta=[67.5, 180],
    width=[135, 90],
    marker_color=["blue","green"],
    marker_line_color="white",
    marker_line_width=2,
    opacity=1
    )
)

## overlay a bar that removes the central circle
fig.add_trace(go.Barpolar(
    r=[1],
    theta=[0],
    width=[360],
    marker_color=["white"],
    marker_line_color="white",
    marker_line_width=2,
    opacity=1
    )
)

fig.update_layout(
    template=None,
    polar = dict(
        radialaxis = dict(range=[0, 6], showticklabels=False, ticks=''),
        angularaxis = dict(showticklabels=False, ticks='')
    )
)

fig.show()
![enter image description here]()
You would then need to add annotations for the names, and the values in the hovertemplate. You're basically building the chart from the ground up so I admit it will be a painstaking process.
Note: anyone with more Plotly experience than myself, please correct me if I am wrong on this, and if thickness of each layer can indeed by controlled by the parameters in the Sunburst graph_object.


