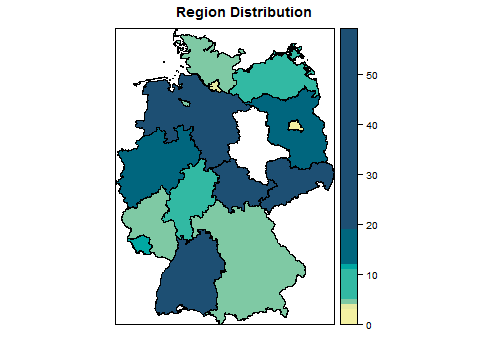
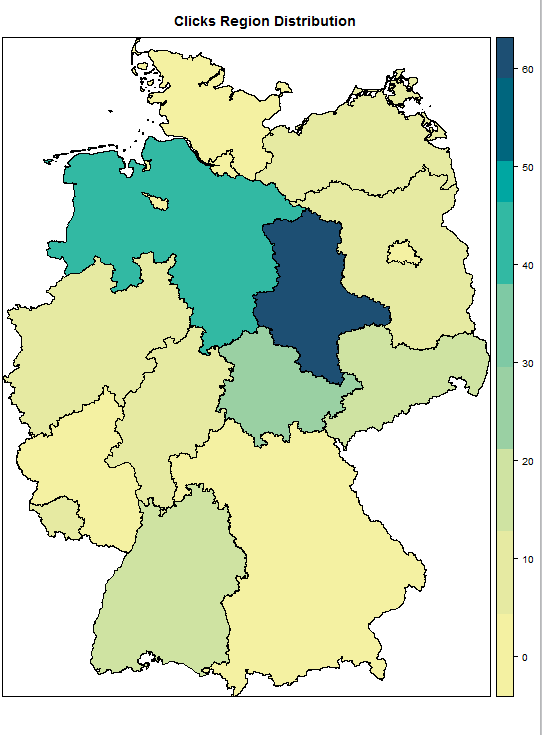
I was working on heat map of Germany using spplot, I had the shape file from GADM German shape file Level 1
http://biogeo.ucdavis.edu/data/gadm2.8/rds/DEU_adm1.rds
I am able to make the heatmap but i suppose the maps are getting wrongly plotted, as for instance in my data "Bremen" has value as 0 but "Sachsen-Anhalt " is being plotted as white with 0 values, is it something with the mapping in the .rds file ?
Here is my code
  library(sp)
library(latticeExtra)

### load the German federal state polygons
my.data <- readRDS("DEU_adm1.rds")
sample <- read.csv(file.choose())
 final <- merge(x =my.data@data, y = sample, by = "ID_1", all.y = TRUE)
my.data@data <- data.frame(my.data@data, sample[match(my.data@data[,"ID_1"], sample[,"ID_1"]),])
### German language hick-ups need to be resolved
enamessp <- gsub("?", "ue", my.data@data$NAME_1)
my.data@data$NAME_1 <- enamessp

### insert the newly created clicksvariable into the spatial data frame
my.data$clicks <- sample$clicks


clrs <- c('#F4F1A2',
          '#F4F1A2',
          '#E6EAA2',
          '#E6EAA2',
          '#CFE3A2',
          '#CFE3A2',
          '#9AD0A3',
          '#9AD0A3',
          '#7FC9A4',
          '#7FC9A4',
          '#32B9A3',
          '#32B9A3',
          '#00A7A2',
          '#00667E',
          '#00667E',
          '#1D4F73'
)
spplot(my.data, zcol = "clicks", main = "Region Distribution",
       col.regions = clrs,at=sort(sample$clicks))
Here is the dput for sample :
structure(list(ID_1 = c(7L, 4L, 5L, 14L, 12L, 15L, 11L, 13L,
2L, 3L, 16L, 6L, 10L, 9L, 8L, 1L), clicks = c(19L, 4L, 0L, 12L,
4L, 3L, 8L, 5L, 41L, 12L, 4L, 11L, 59L, 19L, 4L, 25L)), .Names = c("ID_1",
"clicks"), class = "data.frame", row.names = c(NA, -16L))


