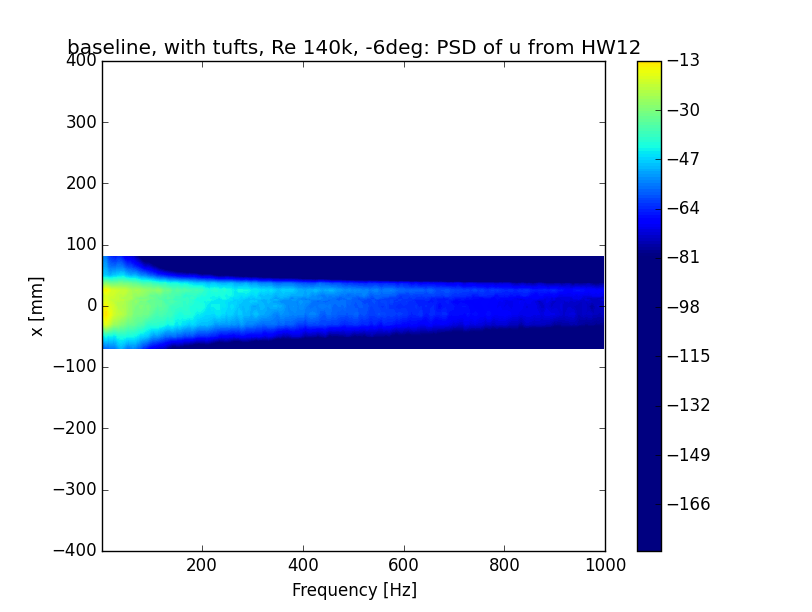
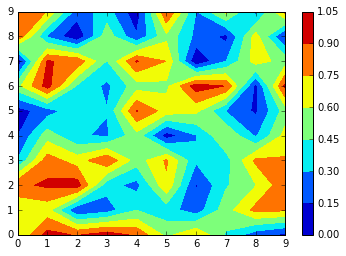
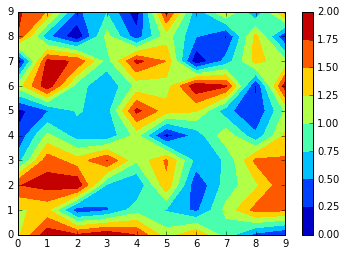
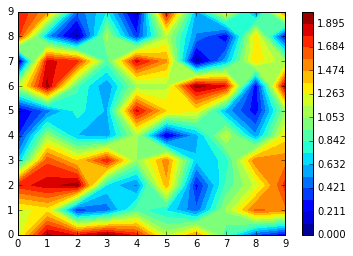
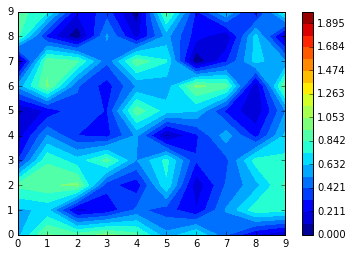
I'm trying to plot a contourf-plot using matplotlib (and numpy of course). And it works, it plots what it should plot, but unfortunatelly I cannot set the colorbar range. The problem is that I have a plenty of plots and need all of them to have the same colorbar (same min and max, same colors). I copy&past-ed almost every code snippet I found on the internet, but without success. My code so far:
    import numpy as np;
    import matplotlib as mpl;
    import matplotlib.pyplot as plt;
    [...]
    plotFreq, plotCoord = np.meshgrid(plotFreqVect, plotCoordVect);

    figHandler = plt.figure();
    cont_PSD = plt.contourf(plotFreq, plotCoord, plotPxx, 200, linestyle=None);


    normi = mpl.colors.Normalize(vmin=-80, vmax=20);

    colbar_PSD = plt.colorbar(cont_PSD);
    colbar_PSD.set_norm(normi);
    #colbar_PSD.norm = normi;
    #mpl.colors.Normalize(vmin=-80, vmax=20);

    plt.axis([1, 1000, -400, 400]);
As you can see there are three different lines for the colorbar norm, none of them is working. The range is still set automatically... I mean everything else is working, why not the colorbar? I don't even get errors or warnings.
Thanks, itpdg
EDIT 1: Pictures, with plt.clim(-80,20):

