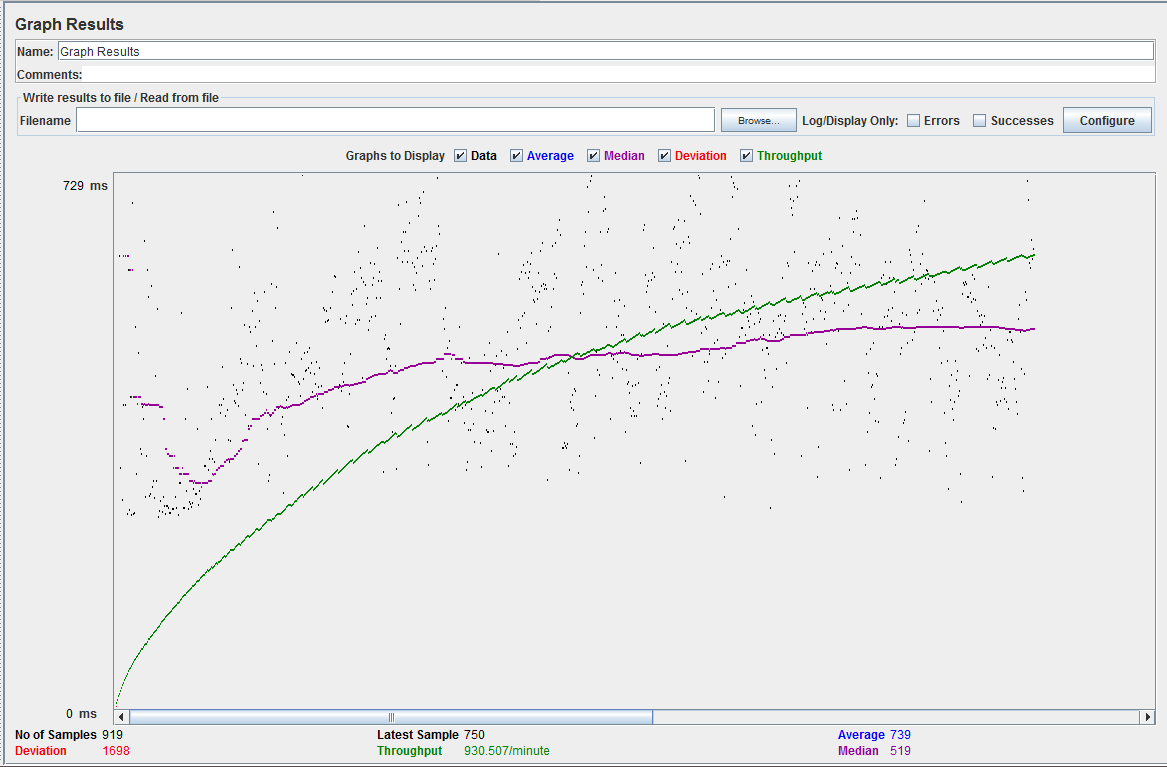
Is there any possibilities to get my below mentioned Graph Results in JMeter test, which is executed in non GUI mode. I can extract its values using csv, but we need to run the test in non GUI mode to get dashboard results also. Any possibilities for this ?
Given you run your JMeter test in command-line non-GUI mode like:
jmeter -n -t test.jmx -l results.jtl
Once test is finished you should be able to open JMeter GUI, add Graph Results listener, locate results.jtl file using "Browse" button and you will see the chart.
Also there is an option to generate some charts in unattended manner using Command-Line Graph Plotting Tool available via JMeter Plugins project, see Automatically generating nice graphs at end of your Load Test with Apache JMeter and JMeter-Plugins guide for details.
jmeter -g results.jtl -o /path/to/dashboard/folder, see Generating Reports chapter for more information. Alternatively you can upload your .jtl results file to a 3rd-party analysis service like BM.Sense –
Alarmist There is a 3rd party plugin that allows you to monitor a NON-GUI test from a browser without further work.
After installing the plugin with JMeter-Plugins manager following this documentation.
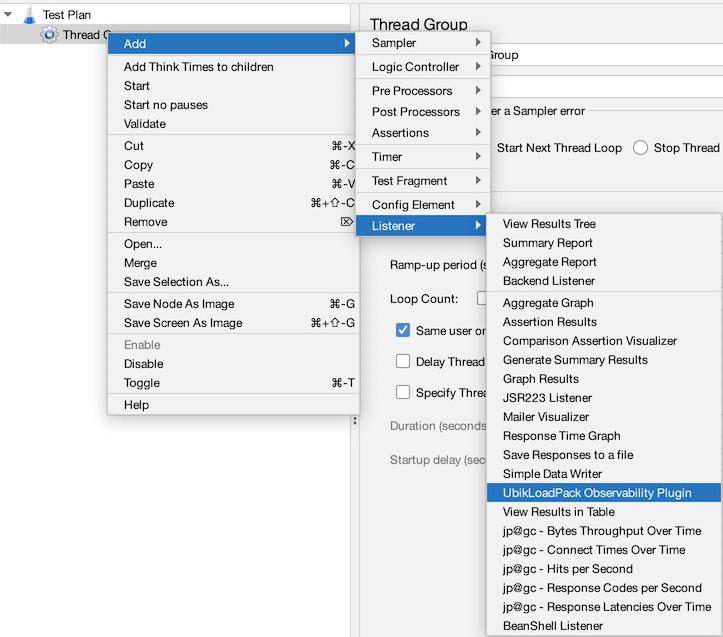
Add the UbikLoadPack observality plugin to your test plan:
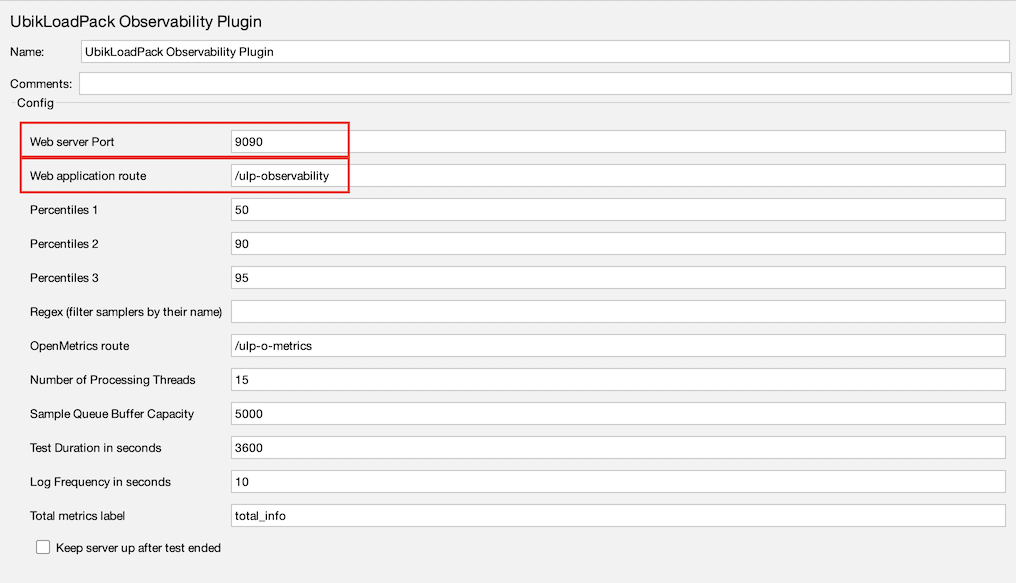
The listener will be added, you can then adjust properties:
You’ll be able to follow it from browser at url:
- http://jmeter_host:9090/ulp-observability
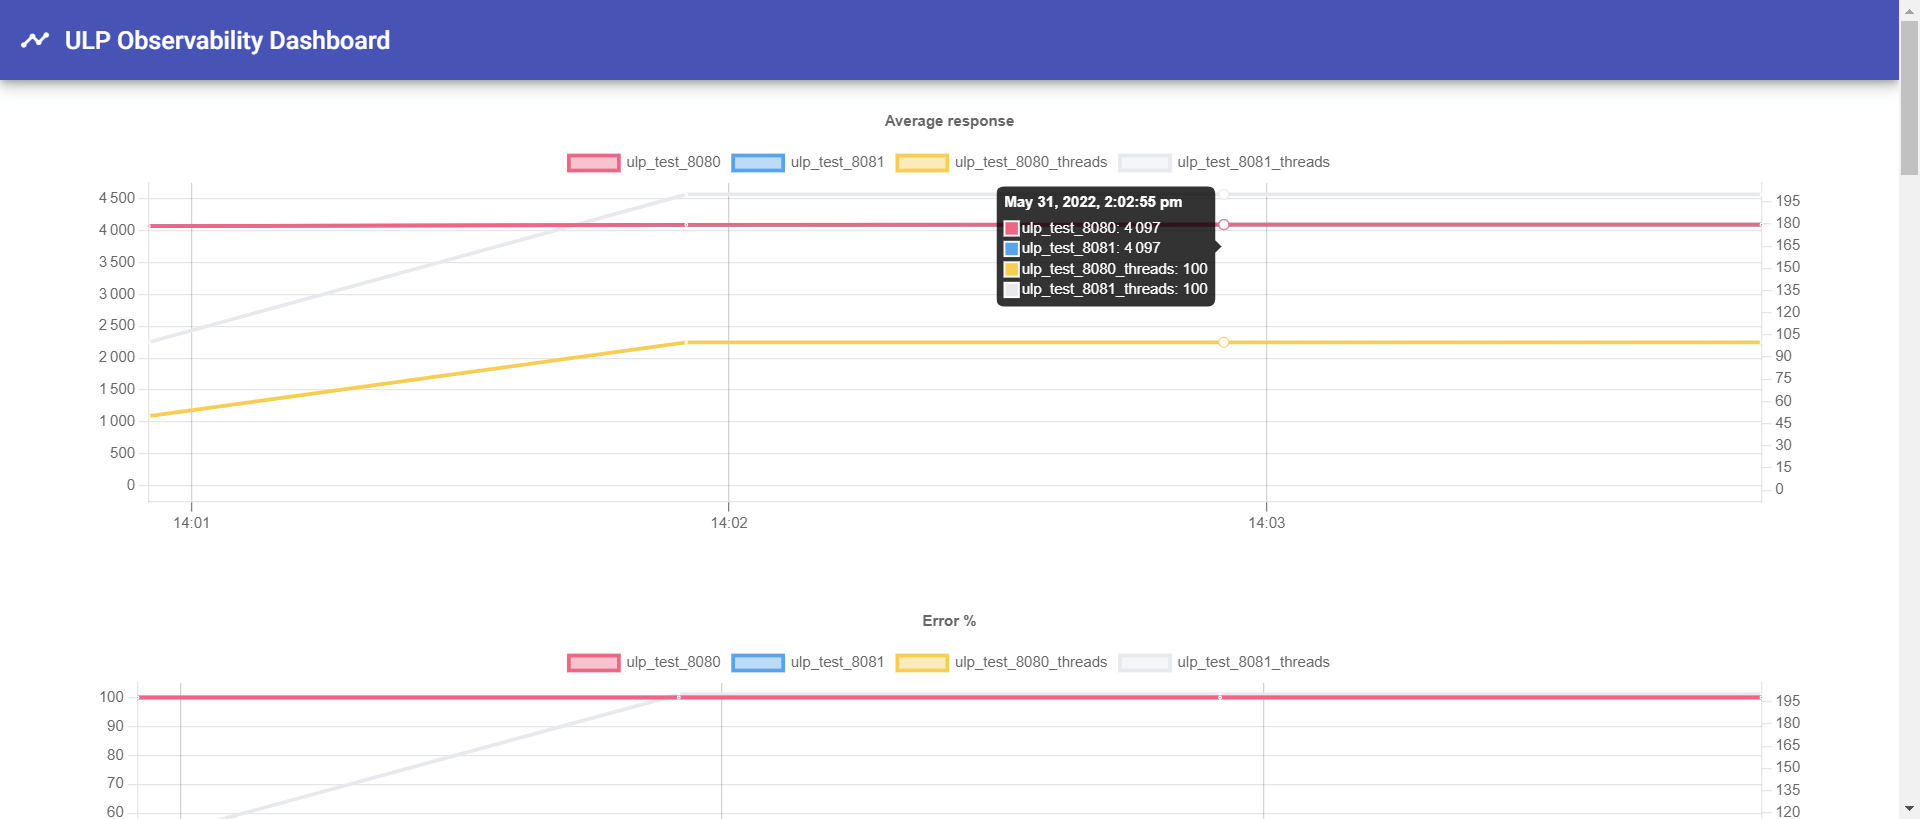
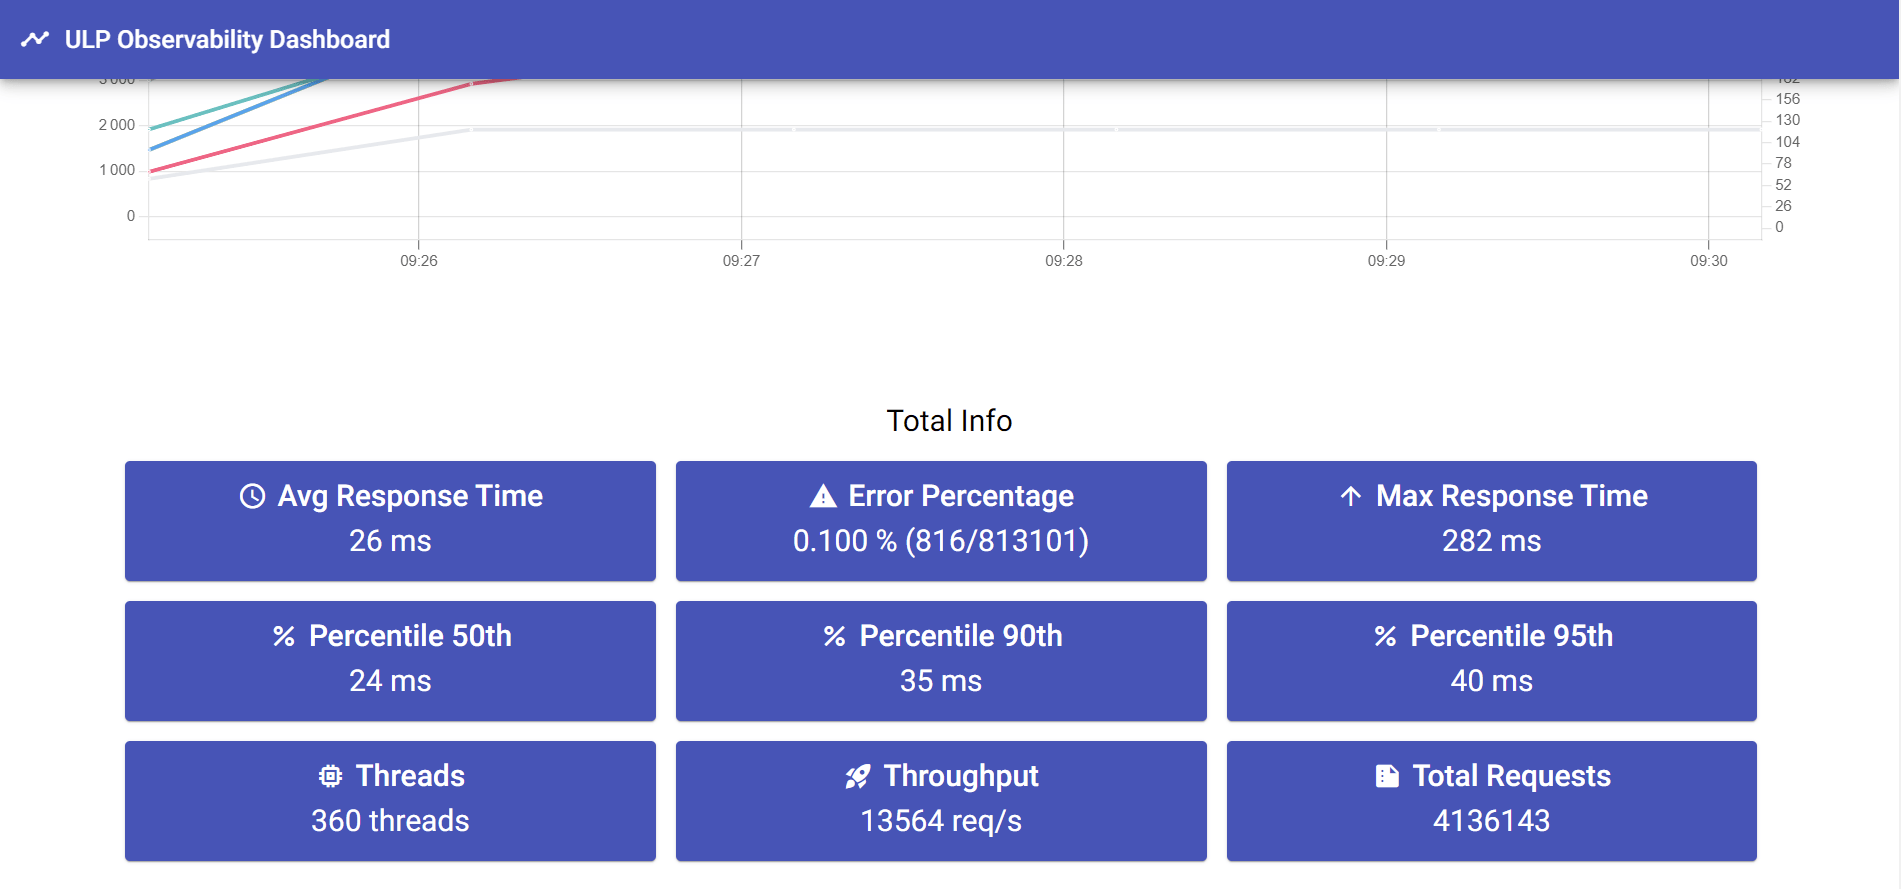
In the browser, you'll have a web page showing:
- A set of Live graphs for average response times, percentiles, error rate
- Live Summary metrics from test start
I am trying to write web app based on Django to work with test results, do an online monitoring, etc. (kinda dashboard) for load tests which runned in Jmeter console mode (incl. distributive testing). Maybe you will want to participate in development or so :): https://github.com/v0devil/JMeter-Control-Center
© 2022 - 2025 — McMap. All rights reserved.

