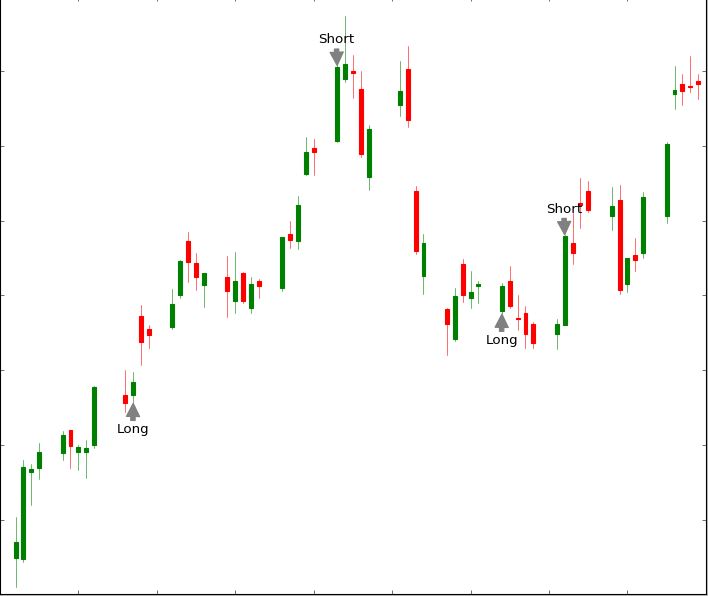
With the following code I am plotting a candlestick graph and also make use of annotations. I have played arround until I found the right positions for the text, but I still don't understand what the figures xytext=(-15, -27) and xytext=(-17, 20) have to do with their current position.
It is very strange to me. could somebody please explain it to me? Many thanks in advance!
This is what my graph looks like and below is the code:
import matplotlib.pyplot as plt
import matplotlib.dates as mdates
from matplotlib.finance import candlestick_ohlc
from matplotlib import style
import pandas_datareader
import datetime as dt

style.use('classic')
start = dt.datetime(2017,1,1)
end = dt.datetime(2017,4,1)

def graph(stock):
    ax1 = plt.subplot2grid((1,1), (0,0))
    stock_data = pandas_datareader.DataReader(name=stock, data_source='google', start=start, end=end)
    stock_data.reset_index(inplace=True)
    stock_data['Date'] = stock_data['Date'].map(mdates.date2num)
    candlestick_ohlc(ax1, stock_data.values, width=0.5, colorup='g', colordown='r')

    ax1.annotate('Long',
                 xy=(stock_data['Date'][10], stock_data['Low'][10]),
                 xytext=(-15, -27),
                 textcoords='offset points',
                 arrowprops=dict(facecolor='grey', color='grey'))

    ax1.annotate('Short',
                 xy=(stock_data['Date'][28], stock_data['High'][28]),
                 xytext=(-17, 20),
                 textcoords='offset points',
                 arrowprops=dict(facecolor='grey', color='grey'))

    ax1.annotate('Long',
                 xy=(stock_data['Date'][42], stock_data['Low'][42]),
                 xytext=(-15, -27),
                 textcoords='offset points',
                 arrowprops=dict(facecolor='grey', color='grey'))

    ax1.annotate('Short',
                 xy=(stock_data['Date'][48], stock_data['High'][48]),
                 xytext=(-17, 20),
                 textcoords='offset points',
                 arrowprops=dict(facecolor='grey', color='grey'))

    plt.show()

graph('TSLA')

