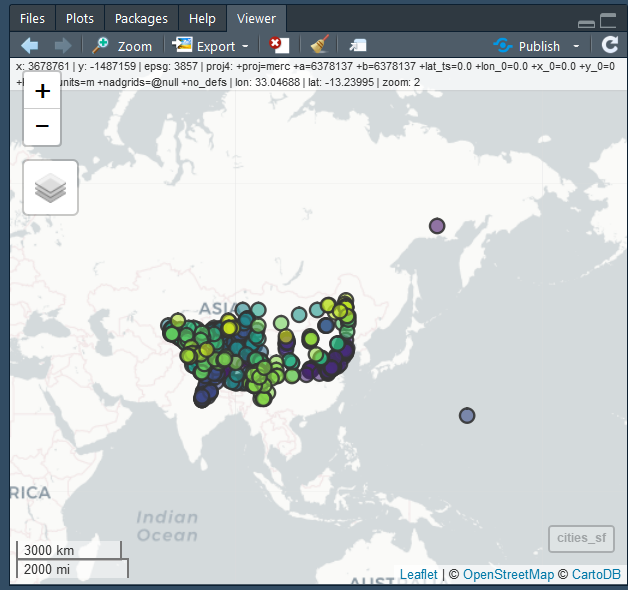
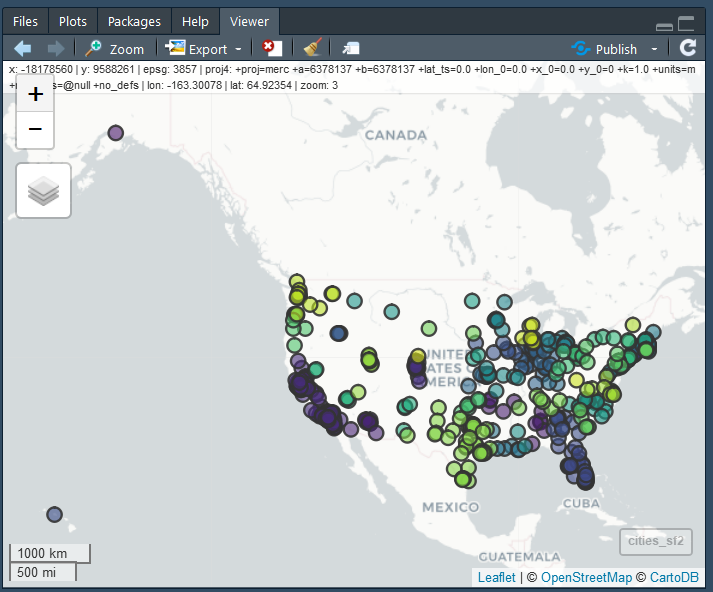
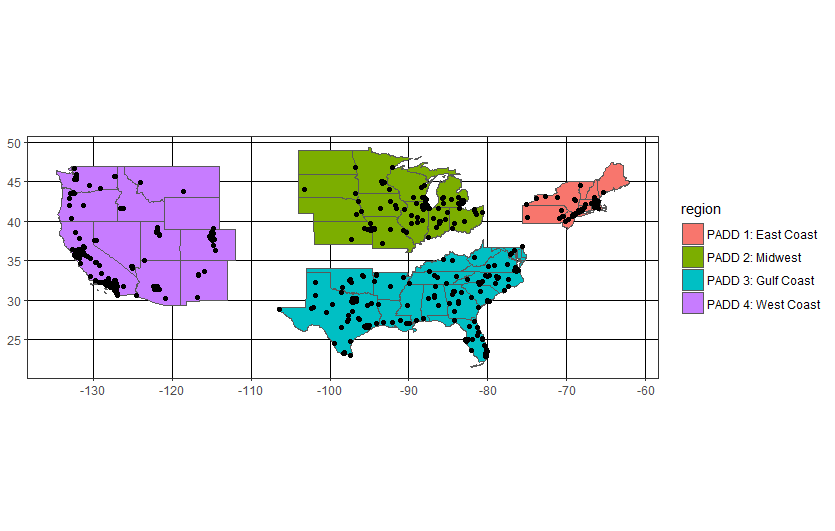
I would like to plot a map of the US using ggplot2 where the map is divided into 1 of 4 regions with blank spaces b/w each. Additionally, I have a set of city coordinates I would like to map onto each region. My issue is the following. I can create the map just fine, but I cannot get the city coordinate points to fall on the map. I understand that adding spaces between the region necessitates changing the coordinates for the map but I've also changed the coordinates for the cities accordingly such that I thought they would shift with on another but the whole thing is a mess...
library(maps)
library(ggplot2)

us.map <-  map_data('state')

# add map regions
us.map$PADD[us.map$region %in%
          c("connecticut", "maine", "massachusetts", "new hampshire", "rhode island", "vermont", "new jersey", "new york", "pennsylvania")] <- "PADD 1: East Coast"
us.map$PADD[us.map$region %in%
          c("illinois", "indiana", "michigan", "ohio", "wisconsin", "iowa", "kansas", "minnesota", "missouri", "nebraska", "north dakota", "south dakota")] <- "PADD 2: Midwest"
us.map$PADD[us.map$region %in%
          c("delaware", "florida", "georgia", "maryland", "north carolina", "south carolina", "virginia", "district of columbia", "west virginia", "alabama", "kentucky", "mississippi", "tennessee", "arkansas", "louisiana", "oklahoma", "texas")] <- "PADD 3: Gulf Coast"
us.map$PADD[us.map$region %in%
          c("alaska", "california", "hawaii", "oregon", "washington", "arizona", "colorado", "idaho", "montana", "nevada", "new mexico", "utah", "wyoming")] <- "PADD 4: West Coast"

# subset the dataframe by region (PADD) and move lat/lon accordingly
us.map$lat.transp[us.map$PADD == "PADD 1: East Coast"] <- us.map$lat[us.map$PADD == "PADD 1: East Coast"]
us.map$long.transp[us.map$PADD == "PADD 1: East Coast"] <- us.map$long[us.map$PADD == "PADD 1: East Coast"] + 5

us.map$lat.transp[us.map$PADD == "PADD 2: Midwest"] <- us.map$lat[us.map$PADD == "PADD 2: Midwest"]
us.map$long.transp[us.map$PADD == "PADD 2: Midwest"] <- us.map$long[us.map$PADD == "PADD 2: Midwest"]

us.map$lat.transp[us.map$PADD == "PADD 3: Gulf Coast"] <- us.map$lat[us.map$PADD == "PADD 3: Gulf Coast"] - 3
us.map$long.transp[us.map$PADD == "PADD 3: Gulf Coast"] <- us.map$long[us.map$PADD == "PADD 3: Gulf Coast"]

us.map$lat.transp[us.map$PADD == "PADD 4: West Coast"] <- us.map$lat[us.map$PADD == "PADD 4: West Coast"] - 2
us.map$long.transp[us.map$PADD == "PADD 4: West Coast"] <- us.map$long[us.map$PADD == "PADD 4: West Coast"] - 10

# plot
ggplot(us.map,  aes(x=long.transp, y=lat.transp), colour="white") +
  geom_polygon(aes(group = group, fill="red")) +
  theme(panel.background = element_blank(),  # remove background
    panel.grid = element_blank(),
    axis.line = element_blank(),
    axis.title = element_blank(),
    axis.ticks = element_blank(),
    axis.text = element_blank()) +
  coord_equal()+ scale_fill_manual(values="lightgrey", guide=FALSE)
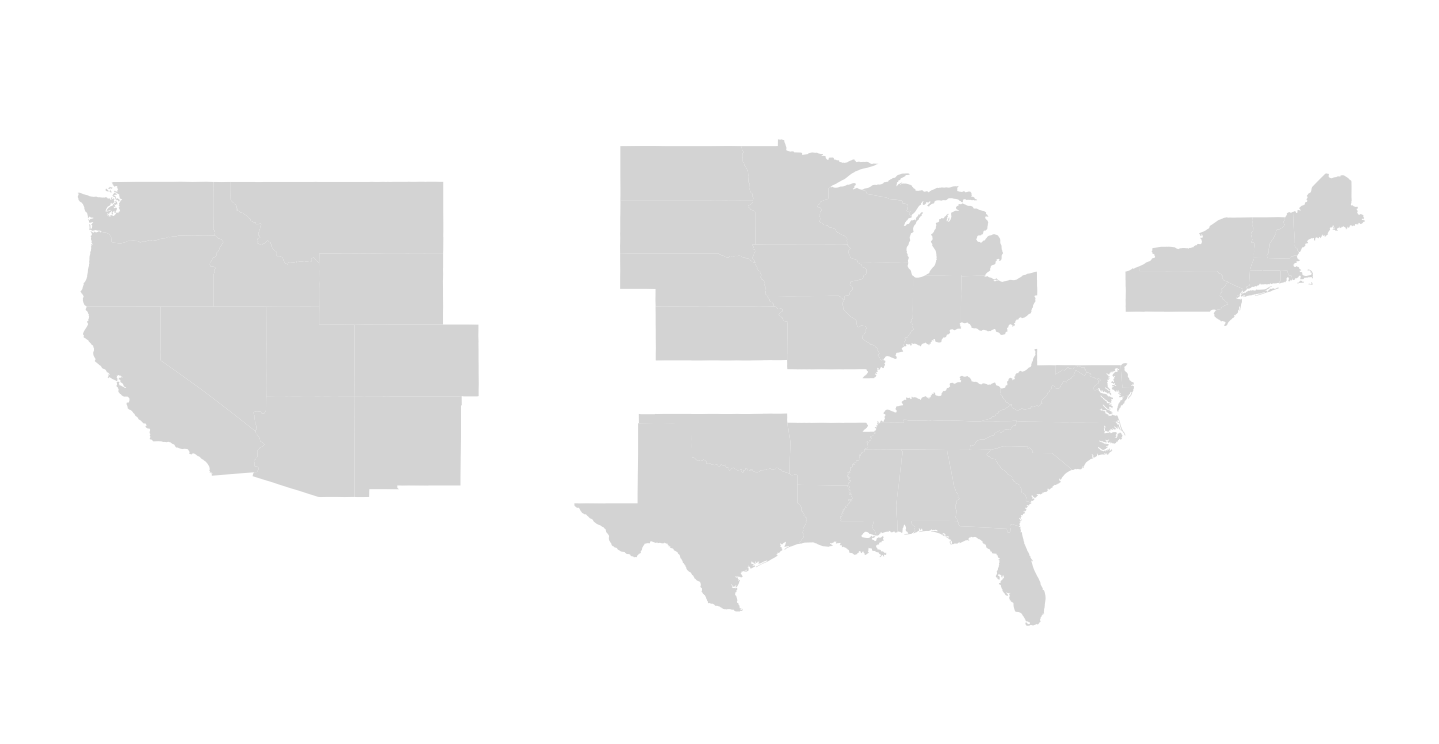
That results in the following:
which is fine (some code obtained from: https://gis.stackexchange.com/questions/141181/how-to-create-a-us-map-in-r-with-separation-between-states-and-clear-labels) but I would like to map a set of coordinates to it.
Link for two compressed datasets, cities2.csv and PADDS.csv used below:
https://www.dropbox.com/s/zh9xyiakeuhgmdy/Archive.zip?dl=0 (sorry, data is too large to enter using dput)
#Two datasets found on dropbox link in zip
cities<-read.csv("cities2.csv")
padds<-read.csv("PADDS.csv")
padds$State<-NULL

colnames(padds)<-c("state","PADD")
points<-merge(cities, padds, by="state",all.x=TRUE)

#Shift city coordinates according to padd region
points$Long2<-ifelse(points$PADD =="PADD 1: East Coast", points$Long+5,  points$Long)
points$Long2<-ifelse(points$PADD =="PADD 4: West Coast", points$Long-10,  points$Long2)

points$Lat2<-ifelse(points$PADD =="PADD 3: Gulf Coast", points$Lat-3,  points$Lat)
points$Lat2<-ifelse(points$PADD =="PADD 4: West Coast", points$Lat-2,  points$Lat2)
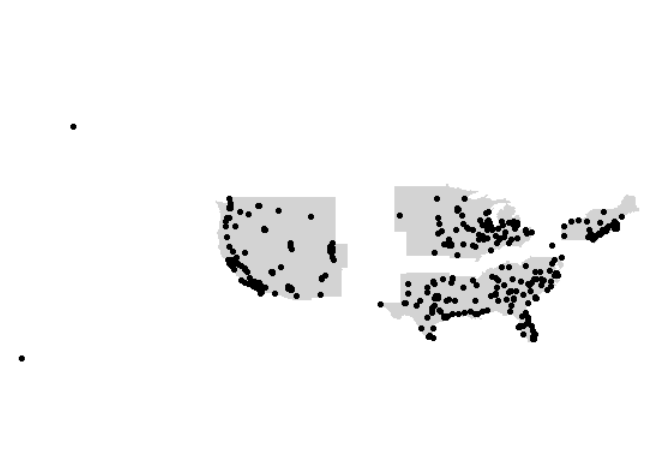
That results in the following:
Clearly something is going wrong here... Any help is much appreciated.

