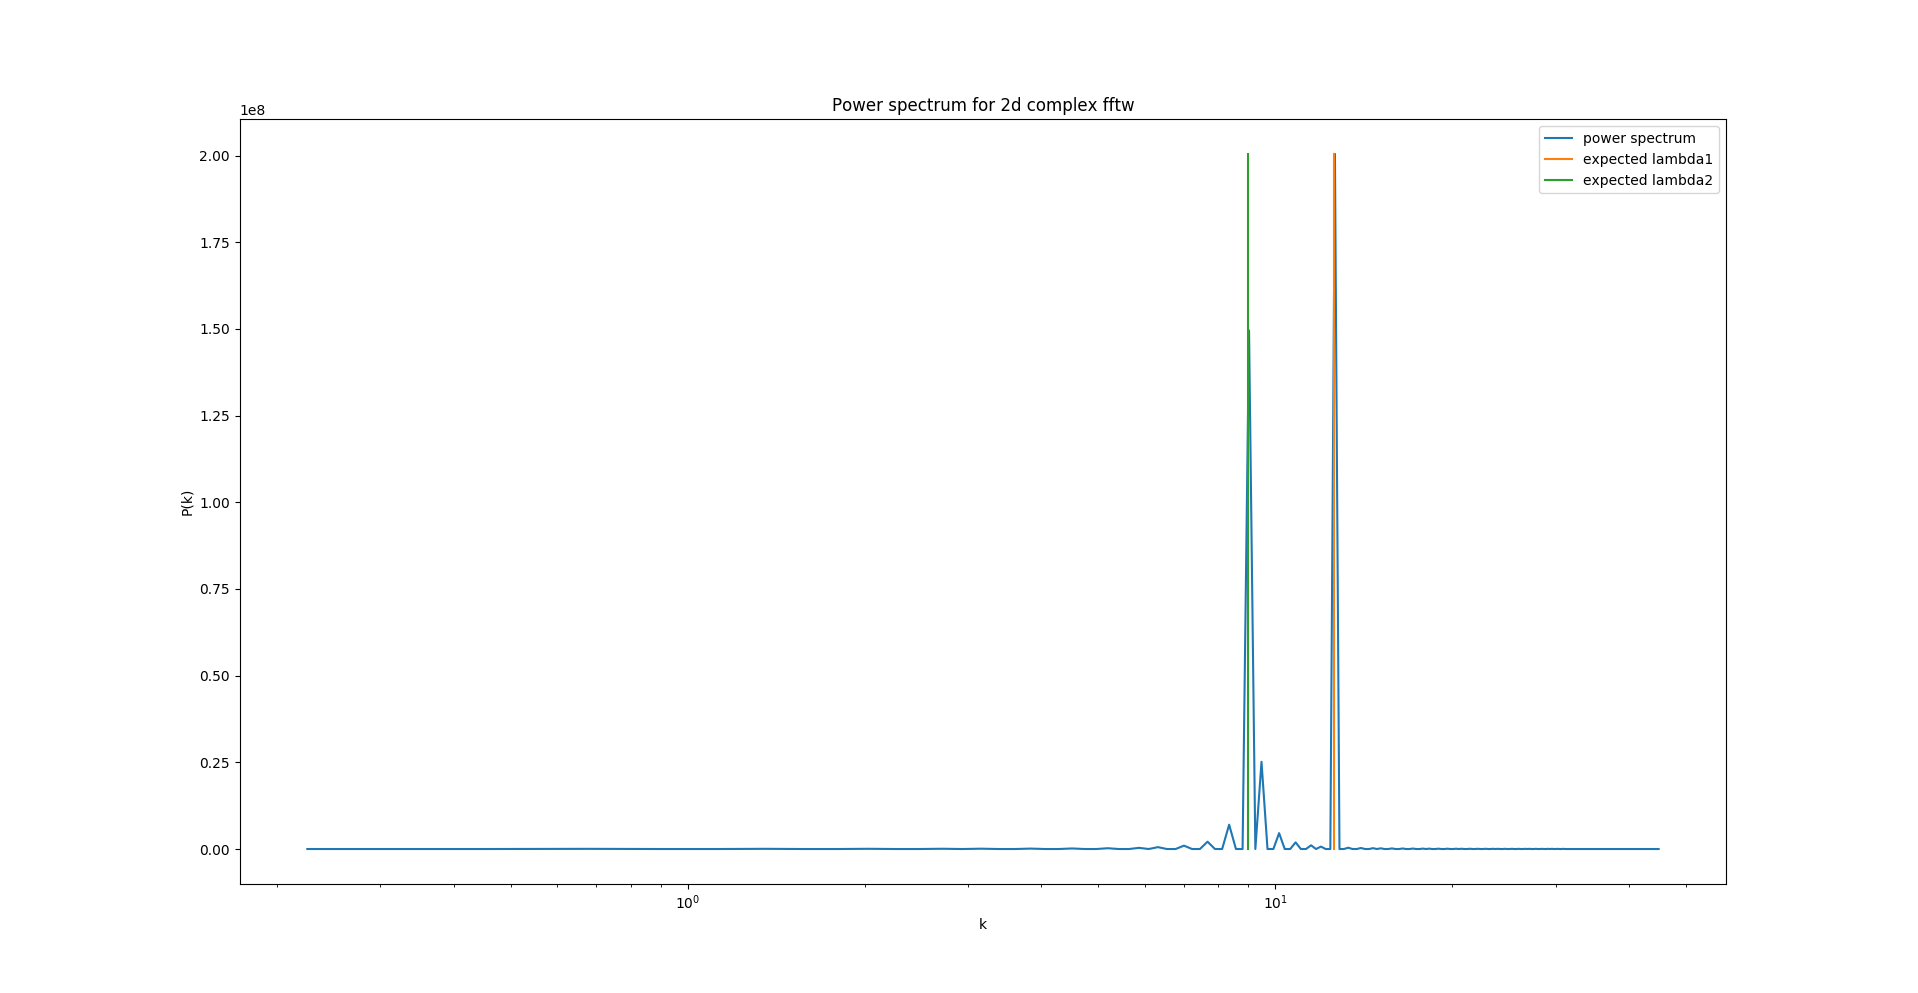
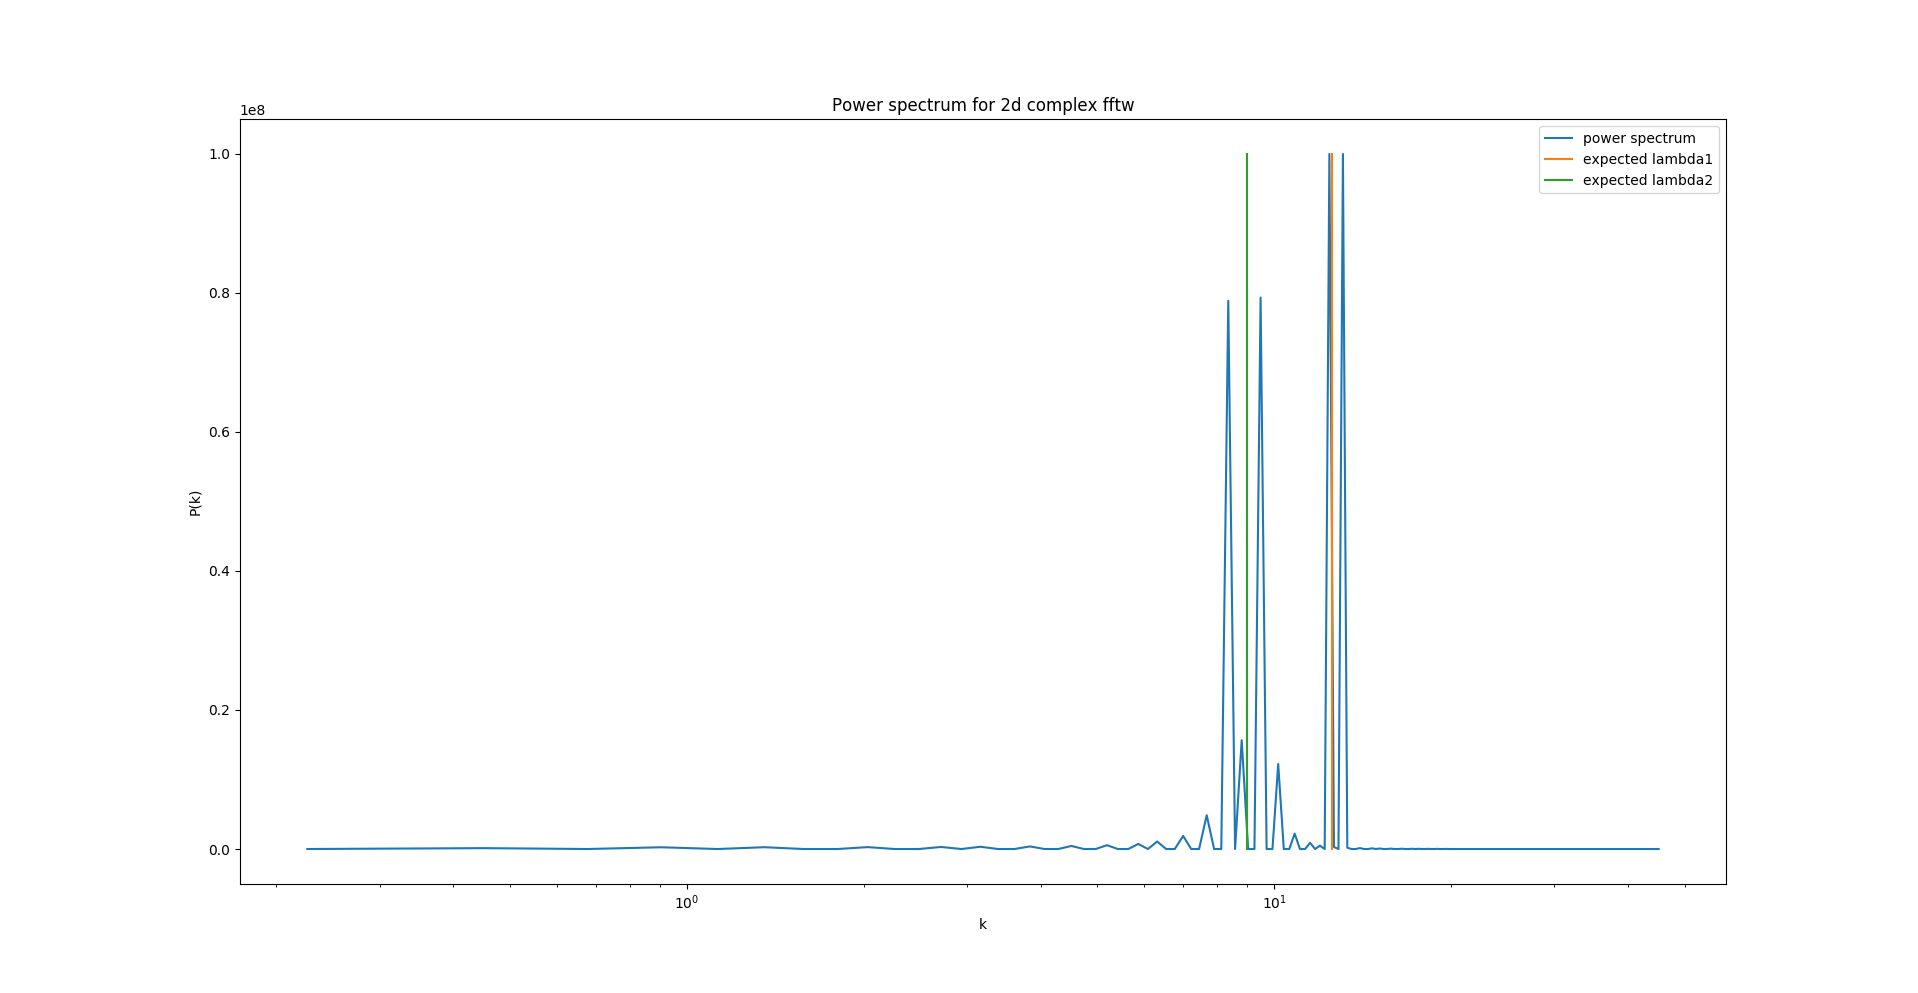
I am learning how to handle the FFTW package with fortran. To produce an easily verifiable example, I compute the power spectrum of a 2d plane, which I fill with two distinct superpositioned waves. This way, I know exactly where to expect peaks in the power spectrum.
As the FFTW documentation is more extensive for C, I first implemented the algorithm in C, which gives me quite satisfactory results:
 "lambda1" and "lambda2" are the known, expected wavelengths. The blue line is the obtained power spectrum.
Then I tried to do exactly the same with fortran, which gives weird results:

I have no idea where to look for possible errors. The codes execute without a hitch. Can anybody help?
Here is the C code, compiled with: gcc stackexchange.c -o a.out -I/home/myname/.local/include -lfftw3 -lm -g -Wall (gcc 5.4.0)
#include <fftw3.h>
#include <math.h>
#include <stdio.h>
#include <stdlib.h>

int main(void)
{
    // parameters
    int Nx = 200;
    int Ny = 100;
    int nsamples = 200;
    float pi = 3.1415926;
    float physical_length_x = 20;
    float physical_length_y = 10;
    float lambda1 = 0.5;
    float lambda2 = 0.7;
    float dx = physical_length_x/Nx;
    float dy = physical_length_y/Ny;
    float dkx = 2*pi/physical_length_x;
    float dky = 2*pi/physical_length_y;

    // counters/iterators
    int ind, i, j, ix, iy, ik;

    // power spectra stuff
    float *Pk, *distances_k, d, kmax;
    float *Pk_field;


    // FFTW vars and arrays
    fftw_complex *in, *out;
    fftw_plan my_plan;

    // allocate arrays for input/output
    in  = (fftw_complex *) fftw_malloc(sizeof(fftw_complex) * Nx * Ny);
    out = (fftw_complex *) fftw_malloc(sizeof(fftw_complex) * Nx * Ny);

    // Create Plan
    int n[2]; n[0] = Nx; n[1] = Ny;
    my_plan = fftw_plan_dft(2, n, in, out, FFTW_FORWARD, FFTW_ESTIMATE);

    // fill up array with a wave
    for (i=0; i<Nx; i++){
      for (j=0; j<Ny; j++){
        ind = i*Ny + j;
        in[ind][0] = cos(2.0*pi/lambda1*i*dx) + sin(2.0*pi/lambda2*j*dy);
      }
    }

    // execute fft
    fftw_execute(my_plan); /* repeat as needed */

    // Calculate power spectrum: P(kx, ky) = |F[delta(x,y)]|^2
    Pk_field = malloc(sizeof(float)*Nx*Ny);
    for (i=0; i<Nx; i++){
      for (j=0; j<Ny; j++){
        ind = i*Ny+j;
        Pk_field[ind] = out[ind][0]*out[ind][0] + out[ind][1]*out[ind][1];
      }
    }

    Pk = calloc(nsamples, sizeof(float));
    distances_k = malloc(nsamples*sizeof(float));
    kmax = sqrt(pow((Nx/2+1)*dkx, 2) + pow((Ny/2+1)*dky, 2));
    for(i=0; i<nsamples; i++){
      distances_k[i]= 1.0001*i/nsamples*kmax; // add a little more to make sure kmax will fit
    }

    // histogrammize P(|k|)
    for (i=0; i<Nx; i++){

      if (i<Nx/2+1)
        { ix = i; }
      else
        { ix = -Nx+i; }

      for (j=0; j<Ny; j++){

        if (j<Ny/2+1)
          { iy = j; }
        else
          { iy = -Ny+j; }

        ind = i*Ny + j;
        d = sqrt(pow(ix*dkx,2)+pow(iy*dky,2));

        for(ik=0; ik<nsamples; ik++){
          if (d<=distances_k[ik] || ik==nsamples){
            break;
          }
        }

        Pk[ik] += Pk_field[ind];
      }
    }


    //-----------------------------------
    // write arrays to file.
    // can plot them with plot_fftw.py
    //-----------------------------------
    FILE *filep;
    filep = fopen("./fftw_output_2d_complex.txt", "w");
    for (i=0; i<nsamples; i++){
      fprintf(filep, "%f\t%f\n", distances_k[i], Pk[i]);
    }
    fclose(filep);

    printf("Finished! Written results to ./fftw_output_2d_complex.txt\n");


    //----------------------
    // deallocate arrays
    //----------------------
    fftw_destroy_plan(my_plan);
    fftw_free(in); fftw_free(out);

    return 0;
}
This is the Fortran code, compiled with: gfortran stackexchange.f03 -o a.out -L/home/my_name/.local/lib/ -I/home/my_name/.local/include/ -lfftw3 -g -Wall
program use_fftw

  use,intrinsic :: iso_c_binding
  implicit none
  include 'fftw3.f03'

  integer, parameter     :: dp=kind(1.0d0)
  integer, parameter     :: Nx = 200
  integer, parameter     :: Ny = 100
  integer, parameter     :: nsamples = 200
  real(dp), parameter    :: pi = 3.1415926d0
  real(dp), parameter    :: physical_length_x = 20.d0
  real(dp), parameter    :: physical_length_y = 10.d0
  real(dp), parameter    :: lambda1 = 0.5d0
  real(dp), parameter    :: lambda2 = 0.7d0
  real(dp), parameter    :: dx = physical_length_x/real(Nx,dp)
  real(dp), parameter    :: dy = physical_length_y/real(Ny,dp)
  real(dp), parameter    :: dkx = 2.d0 * pi / physical_length_x
  real(dp), parameter    :: dky = 2.d0 * pi / physical_length_y

  integer :: i, j, ix, iy, ik
  real(dp):: kmax, d

  complex(dp), allocatable, dimension(:,:)    :: arr_in, arr_out, Pk_field
  real(dp), allocatable, dimension(:)         :: Pk, distances_k
  integer*8                                   :: my_plan
  integer                                     :: n(2) = (/Nx, Ny/)


  allocate(arr_in( 1:Nx,1:Ny))
  allocate(arr_out(1:Nx,1:Ny))

  ! call dfftw_plan_dft_2d(my_plan, Nx, Ny, arr_in, arr_out, FFTW_FORWARD, FFTW_ESTIMATE) ! doesn't help either
  call dfftw_plan_dft(my_plan, 2, n, arr_in, arr_out, FFTW_FORWARD, FFTW_ESTIMATE)

  ! fill up wave
  do i = 1, Nx
    do j = 1, Ny
      arr_in(i,j) =cmplx(cos(2.0*pi/lambda1*i*dx)+sin(2.0*pi/lambda2*j*dy) , 0.d0, kind=dp)
    enddo
  enddo

  ! execute fft
  call dfftw_execute_dft(my_plan, arr_in, arr_out)


  allocate(Pk_field(1:Nx, 1:Ny))
  allocate(distances_k(1:nsamples))
  allocate(Pk(1:nsamples))
  Pk=0
  distances_k=0

  ! Get bin distances
  kmax = sqrt(((Nx/2+1)*dkx)**2+((Ny/2+1)*dky)**2)*1.001
  do i = 1, nsamples
    distances_k(i) = i*kmax/nsamples
  enddo

  ! Compute P(k) field, distances field
  do i = 1, Nx
    do j = 1, Ny
      Pk_field(i,j) = arr_out(i,j)*conjg(arr_out(i,j))

      if (i<=Nx/2+1) then
        ix = i
      else
        ix = -Nx+i
      endif
      if (j<=Ny/2+1) then
        iy = j
      else
        iy = -Ny+j
      endif

      d = sqrt((ix*dkx)**2+(iy*dky)**2)

      do ik=1, nsamples
        if (d<=distances_k(ik) .or. ik==nsamples) exit
      enddo

      Pk(ik) = Pk(ik)+real(Pk_field(i,j))
    enddo
  enddo

  ! write file
  open(unit=666,file='./fftw_output_2d_complex.txt', form='formatted')
  do i = 1, nsamples
    write(666, '(2E14.5,x)') distances_k(i), Pk(i)
  enddo
  close(666)


  deallocate(arr_in, arr_out, Pk, Pk_field, distances_k)
  call dfftw_destroy_plan(my_plan)

  write(*,*) "Finished! Written results to fftw_output_2d_complex.txt"

end program use_fftw
For your convenience, this is my short python script that I use to plot the results:
#!/usr/bin/python3

#====================================
# Plots the results of the FFTW
# example programs.
#====================================

import numpy as np
import matplotlib.pyplot as plt
from sys import argv
from time import sleep


errormessage="""
I require an argument: Which output file to plot.
Usage: ./plot_fftw.py <case>
options for case:
    1   fftw_1d_complex.txt
    2   fftw_2d_complex.txt
    3   fftw_1d_real.txt
    4   fftw_2d_real.txt

Please select a case: """


#----------------------
# Hardcoded stuff
#----------------------

file_dict={}
file_dict['1'] = ('fftw_output_1d_complex.txt', '1d complex fftw')
file_dict['2'] = ('fftw_output_2d_complex.txt', '2d complex fftw')
file_dict['3'] = ('fftw_output_1d_real.txt', '1d real fftw')
file_dict['4'] = ('fftw_output_2d_real.txt', '2d real fftw')

lambda1=0.5
lambda2=0.7


#------------------------
# Get case from cmdline
#------------------------

case = ''

def enforce_integer():
    global case
    while True:
        case = input(errormessage)
        try:
            int(case)
            break
        except ValueError:
            print("\n\n!!! Error: Case must be an integer !!!\n\n")
            sleep(2)


if len(argv) != 2:
    enforce_integer()
else:
    try:
        int(argv[1])
        case = argv[1]
    except ValueError:
        enforce_integer()


filename,title=file_dict[case]


#-------------------------------
# Read and plot data
#-------------------------------

k, Pk = np.loadtxt(filename, dtype=float, unpack=True)

fig = plt.figure()

ax = fig.add_subplot(111)
ax.set_title("Power spectrum for "+title)
ax.set_xlabel("k")
ax.set_ylabel("P(k)")
#  ax.plot(k, Pk, label='power spectrum')
ax.semilogx(k[k>0], Pk[k>0], label='power spectrum') # ignore negative k
ax.plot([2*np.pi/lambda1]*2, [Pk.min()-1, Pk.max()+1], label='expected lambda1')
ax.plot([2*np.pi/lambda2]*2, [Pk.min()-1, Pk.max()+1], label='expected lambda2')
ax.legend()

plt.show()

0,1offset thing when computing/comparingdistances_k(still guessing)? – Autrey