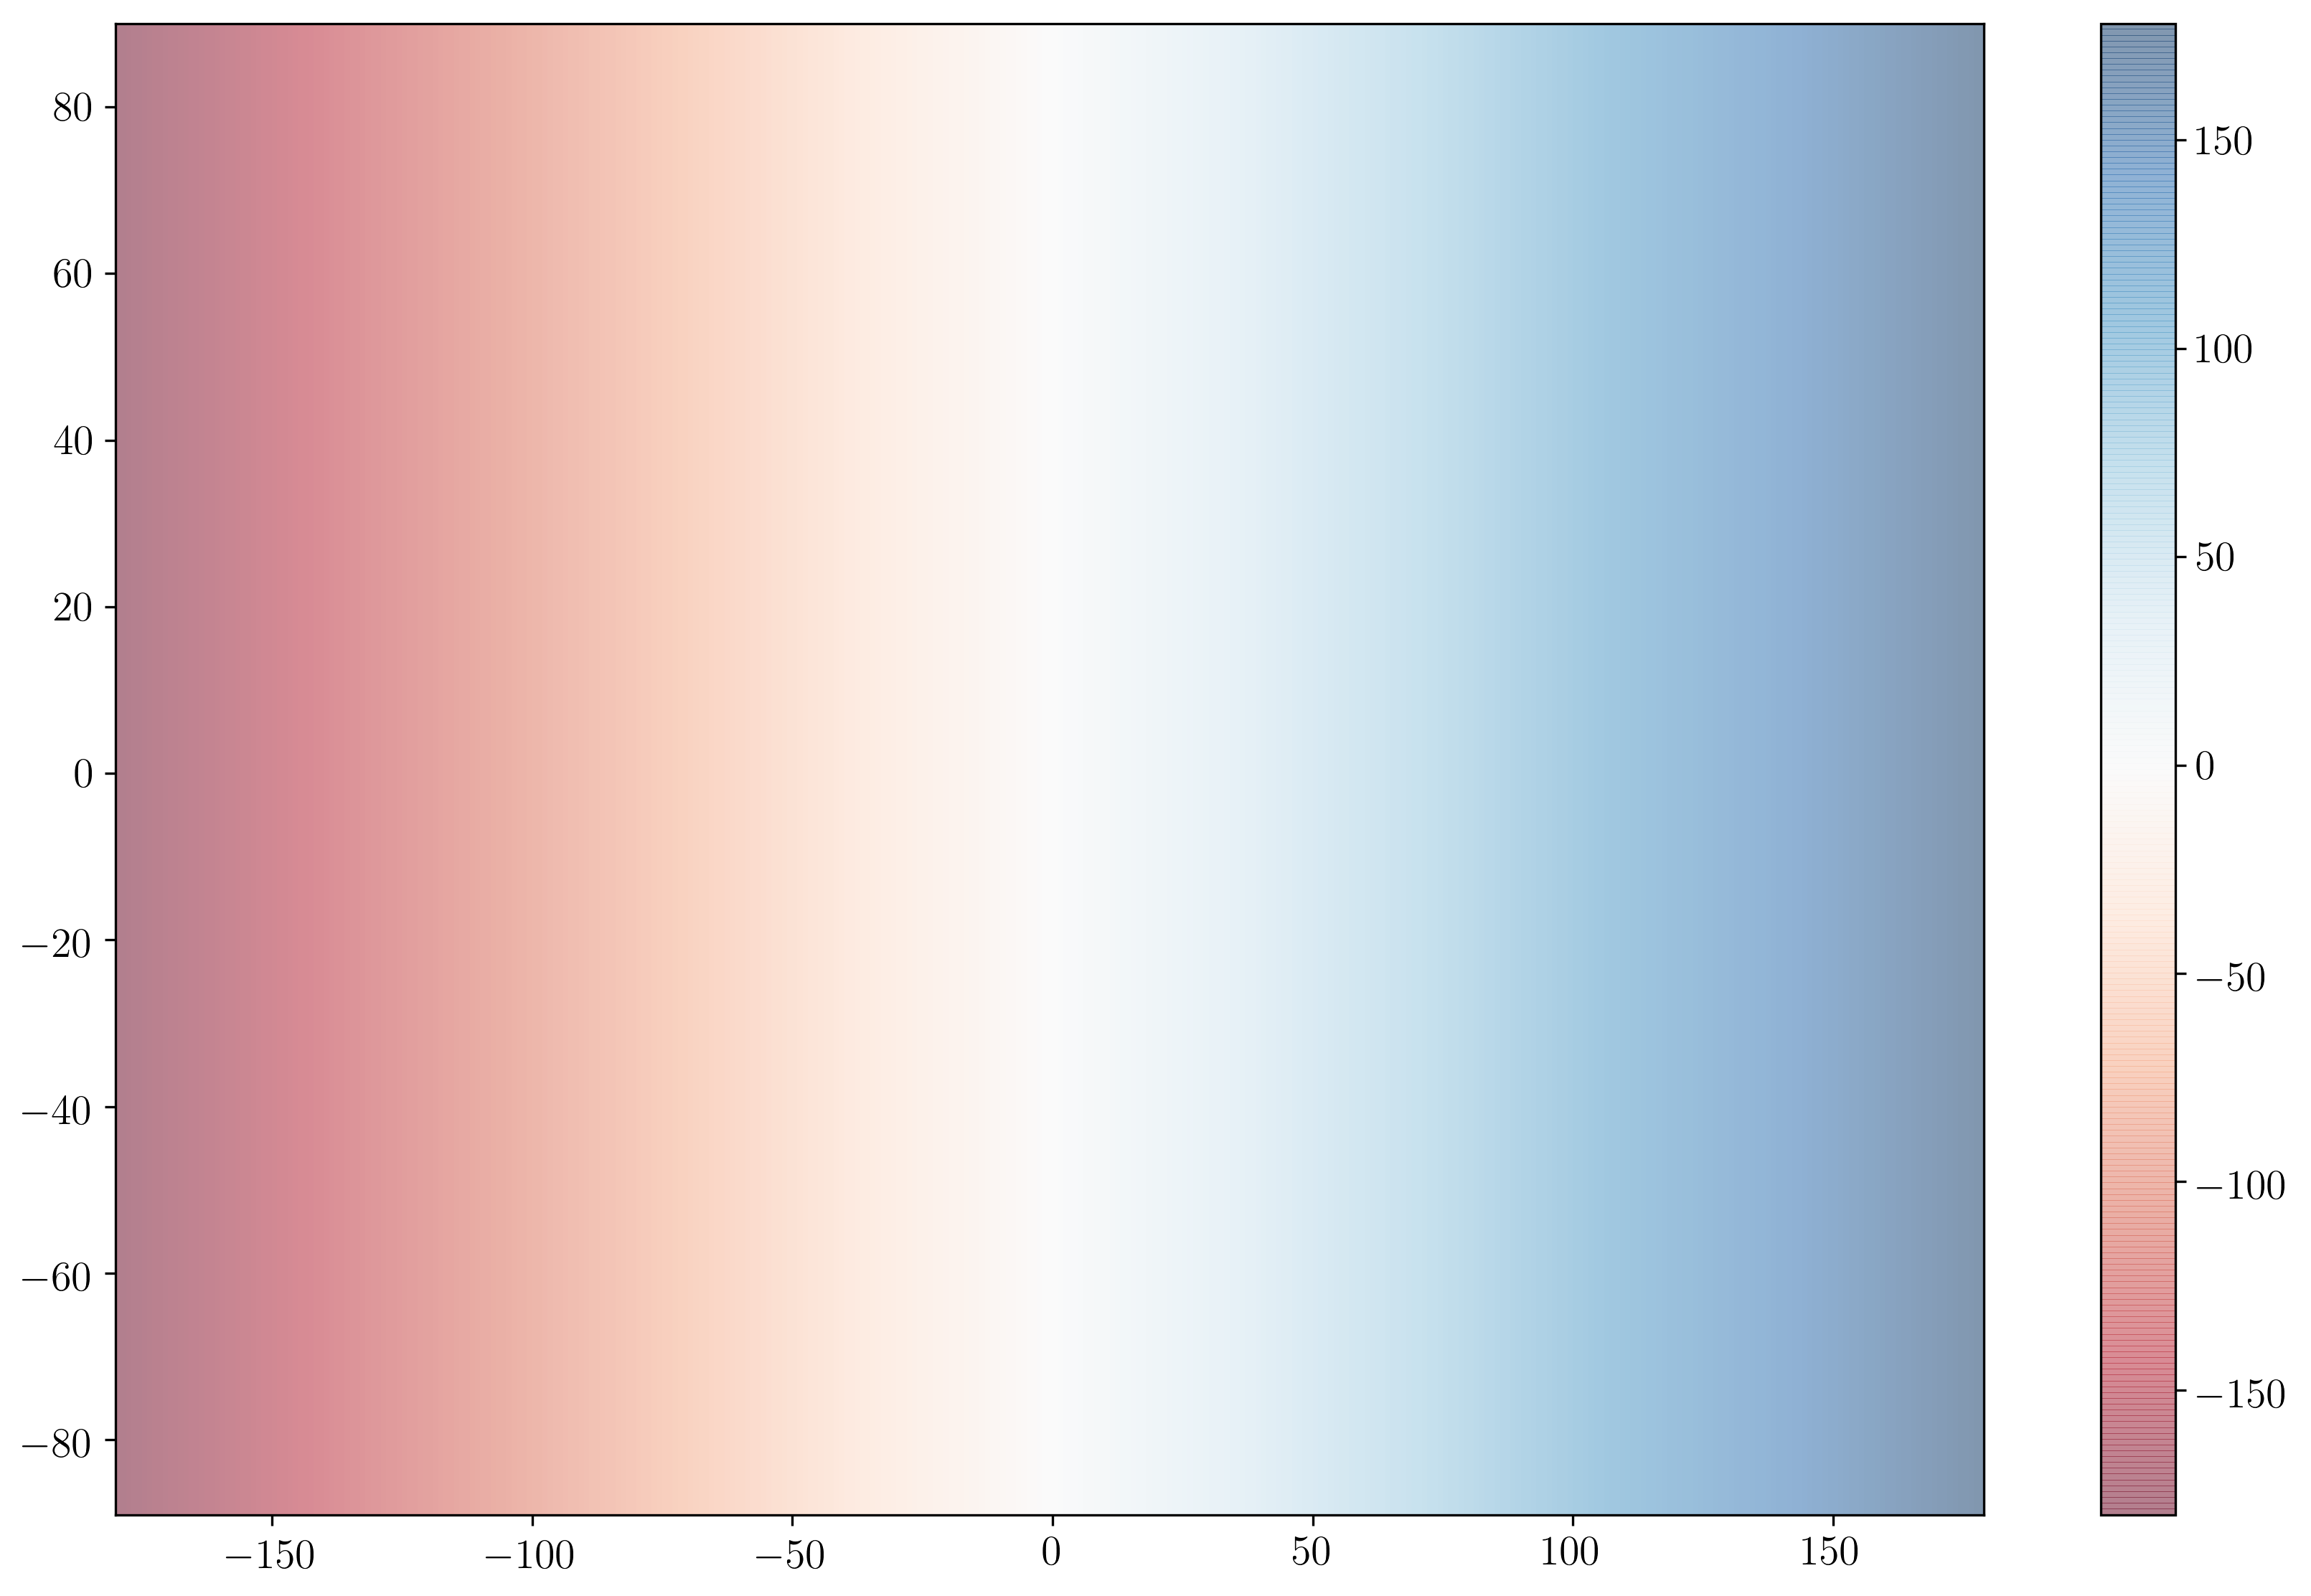
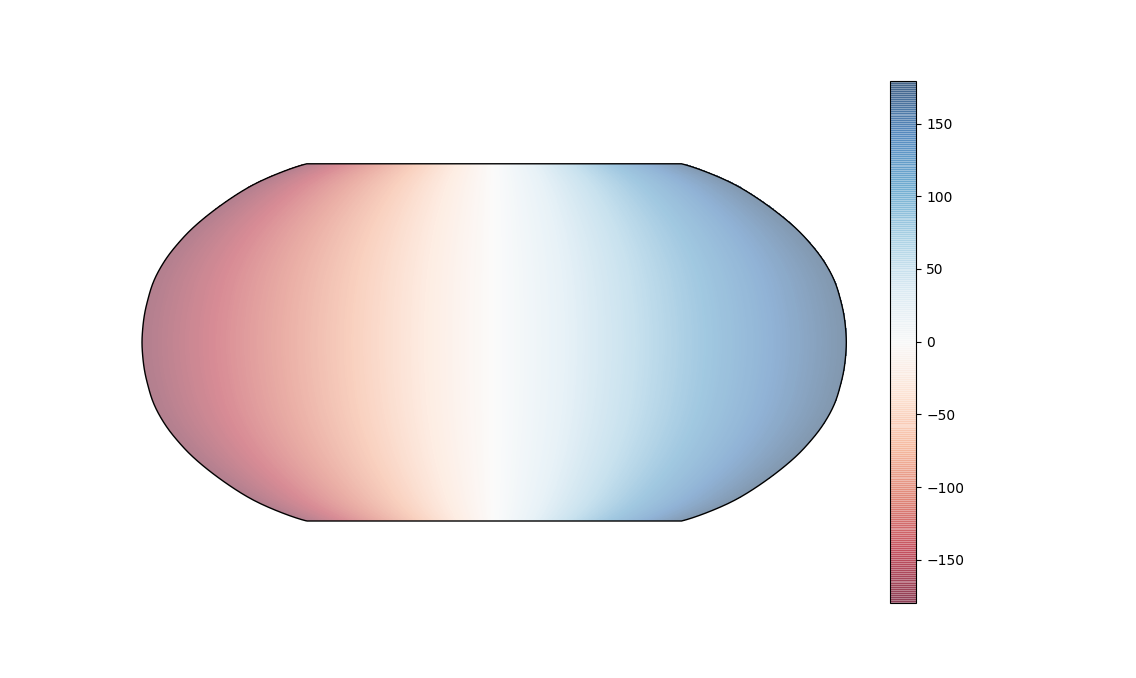
When plotting data using pcolormesh on a basemap projection (or a cartopy projection) I notice strange lines appear when I set the alpha value to less than 1.
Example code:
from mpl_toolkits.basemap import Basemap
import numpy as np
import matplotlib.pyplot as plt

plt.clf()

dpp =1 # degrees per pixel
lons = np.arange(-180,180+dpp,dpp)
lats = -1*np.arange(-90,90+dpp,dpp)

m = Basemap(projection='robin',lon_0=0)
data = np.random.random((np.size(lats), np.size(lons)))
lons, lats = np.meshgrid(lons, lats)
x, y = m(lons, lats)

im = m.pcolormesh(x, y, x, latlon=False, cmap='RdBu')
#im = m.pcolormesh(lons, lats, data, latlon=True, cmap='RdBu')

m.colorbar(im)
plt.show()
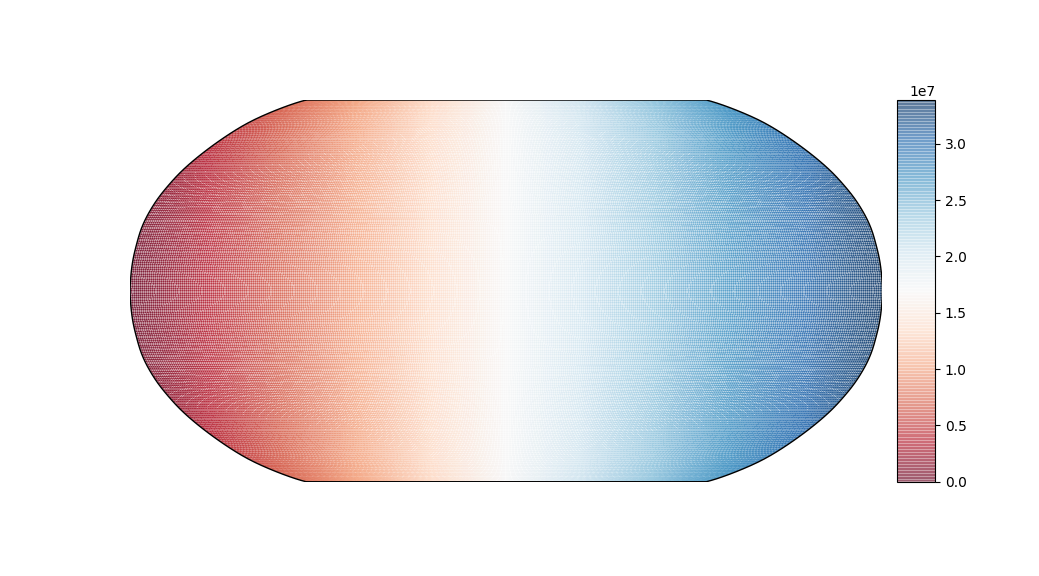
The output shows strange lines appearing:
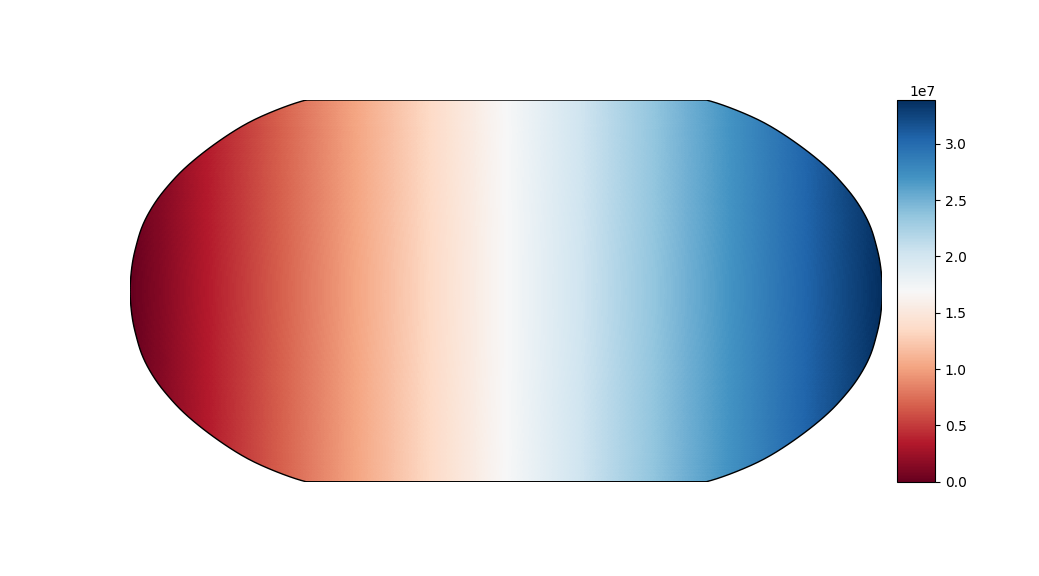
If I instead set alpha=1 the lines disappear and the behavior is as expected:
Any ideas on how to get pcolormesh to work with a nonzero alpha value?


