OPTICS Clustering algorithm. How to get the best epsilon
Asked Answered
R

4

6

I am implementing a project which needs to cluster geographical points. OPTICS algorithm seems to be a very nice solution. It needs just 2 parameters as input(MinPts and Epsilon), which are, respectively, the minimum number of points needed to consider them as a cluster, and the distance value used to compare if two points are in can be placed in same cluster.

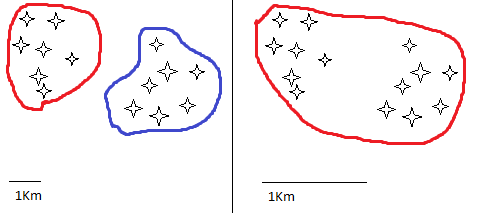
My problem is that, due to the extreme variety of the points, I can't set a fixed epsilon. Just look at the image below.

the problem

The same points structure but in a different scale would result very different. Suppose to set MinPts=2 and epsilon = 1Km. On the left, the algorithm would create 2 clusters(red and blue), but on the right it would create one single cluster containing all of the points(red), but I would like to obtain 2 clusters even on the right.

So my question is: is there any kind of way to calculate dynamically the epsilon value to get this result?

EDIT 05 June 2012 3.15pm: I thought I was using the OPTICS algorithm implementation from the javaml library, but it seems it is actually a DBSCAN algorithm implementation. So the question now is: does anybody know a java based implementation of OPTICS algorithm?

Thank you very much and excuse my for my poor english.

Marco

Rackrent answered 4/6, 2012 at 16:37 Comment(8)
Are the clusters (almost) linearly separable?Kaufman
what do you mean as linearly separable cluster?Rackrent
Linearly separable means that you can draw a single "straight" line separating the points. "Straight" might not be Cartesian/Euclidian straight, cause you can transform the axes, e.g Principal Components. Your example looks to be linear separable.Disburden
I am sorry, I think I don't understand...Rackrent
check out [link]en.wikipedia.org/wiki/Linear_separability or [link]aishack.in/2010/07/linear-separabilityDisburden
Because if they are, you can apply k-means, which has only parameter, and gives you exactly k clusters.Kaufman
the problem of k-means is that it needs the number of clusters you want as input.. In my case, I can't know how many clusters there are, so I must use an algorithm that produces results without specifying the number of clusters you want.Rackrent
WRT edit: according to Wikipedia, OPTICS is in ELKI, and ELKI is Java.Aguayo
A
4

The epsilon value in OPTICS is solely to limit the runtime complexity when using index structures. If you do not have an index for acceleration, you can set it to infinity.

To quote Wikipedia on OPTICS

The parameter \varepsilon is strictly speaking not necessary. It can be set to a maximum value. When a spatial index is available, it does however play a practical role when it comes to complexity.

What you seem to have looks much more like DBSCAN than OPTICS. In OPTICS, you should not need to choose epsilon (it should have been called max-epsilon by the authors!), but your cluster extraction method will take care of that. Are you using the Xi extraction proposed in the OPTICS paper?

minPts is much more important. You should try a value of at least 5 or 10, not 2. With 2, you are essentially performing single-linkage clustering!

The example you gave above should work fine once you increase minPts!

Re: edit: As you can even see in the Wikipedia article, ELKI has a proper OPTICS implementation and it's in Java.

Aguayo answered 4/6, 2012 at 20:20 Comment(5)
What is the OPTICS paper? Actually i've done some research on clustering algorithms and found OPTICS, but I didn't read a paper about itRackrent
First paper in the Wikipedia article on OPTICS: Mihael Ankerst, Markus M. Breunig, Hans-Peter Kriegel, Jörg Sander: OPTICS: Ordering Points To Identify the Clustering Structure. In: ACM SIGMOD international conference on Management of data. Let me guess, you are using the incomplete implementation of OPTICS in Weka?Aguayo
That seems to be a copy of the Weka class. It seems to actually return DBSCAN clusters, not OPTICS.Aguayo
OPTICS returns an ordering of points. Then, this ordering can be used to extract DBScan clusters, do interactive exploration or use another method named extractCluster() to automatically extract clusters. Perhaps that they just implemented Optics + the postprocessing step for extracting DBScan clusters. If that is the case, then Optics is not incomplete (since it is just supposed to return a point ordering). It is some alternative post-processing steps that are missing.Fagin
The extraction of a hierarchy is part of the article. Otherwise, it's not a hierarchical clustering algorithm. If you want a DBSCAN result, use DBSCAN. The cluster order is just an interim result to this objective. (and essentially, the plots appear to be the same as icile plots of Kruskal 1983, just upside down and based on density)Aguayo
D
1

You'd can try to scale epsilon by the total size of the enclosing rectangle. For example, your left data is about 4km x 6km (using my Mark I eyeball to measure) and the right is about 2km x 2km. So, epsilon on the right should be about 2.5 times smaller.

Of course, this doesn't work reliably. If, on your right hand data, there were an additional single point 4km to the right and 2km down, that would make the enclosing rectangle for the right the same as on the left, and you'd get similar (wrong) results.

Disburden answered 4/6, 2012 at 19:2 Comment(8)
I have already thought about a solution like that, but as you said it does not work properly(for the same reason you explained :) )Rackrent
I wonder if you could use a nearest-neighbor type algorithm to get a feel for the spacing between "typical" points, then use that to calculate an estimate for epsilon.Disburden
On your left plot, find the nearest neighbor for each point. The average is ~1km. On your right plot, the typical nearest neighbor is more like 0.2km. Use that to scale epsilon through some magic formula TBD.Disburden
I think that the problem of this approach could be the presence of "noise points". The average would be wrong if there were just a couple of point at a distance like 30kms.Rackrent
Try using median then. Of course, finding nearest neighbors and medians is time consuming, you may spend so much time there that you'd be better off with another algorithm.Disburden
@MarcoGalassi: OPTICS is specially designed to handle noise gracefully; that's what the MinPts parameter controls.Kaufman
Which is why it shouldn't be set to low values such as 1 (completely pointless) or 2 (which makes it essentially equal to single-linkage hierarchical clustering).Aguayo
yes, sure. But I think that noise points also depend on epsilon. If epsilon is too big, than there would be no noise point. Am I not right?Rackrent
M
1

You can try a minimum spanning tree and then remove the longest edge. The remaining spanning tree and the center of them is the best center for OPTICS and you can count the numbers of points around it.

Morpheus answered 1/7, 2012 at 20:37 Comment(1)
Actually OPTICS computes something close to a minimum spanning tree. Computing another minimum spanning tree to chose the stopping threshold for OPTICS does not make much sense. You can often just use infinity.Aguayo
M
0

In your explanation above, it is the change in scale which creates the uncertainty. When your scale gets bigger, your epsilon should change accordingly. Because they are at two very different scales, the two images you've presented are NOT the same set of points. They will not respond identically to your OPTICS algorithm without changing the parameters.

In short, no. there is no way to dynamically calculate epsilon to get this result. Clustering like this is already NP-Hard, and these clustering algorithims (optics, k-means, veroni) can only approximate the optimal solution.

Machree answered 4/6, 2012 at 17:36 Comment(6)
The above example is just to let you understand the problem. The points are placed in the same way because I copied and pasted them, but, in general I am speaking about different points.Rackrent
Actually OPTICS is O(n log n) with index support and doesn't need epsilon. The buggy implementation he used (weka/java-ml) does in fact do DBSCAN, in an O(n^2) implementation since it does not have an index. Neither is NP hard for all I know. k-means is, but the density connected model of DBSCAN is O(n) when you have neighbor lists; computing the neighbors is the most expensive part.Aguayo
-1 for the amount of incorrect information in this reply, sorry.Aguayo
@Anony-Mousse First of all thank you very much for your answers. So, I am apparently using DBSCAN. Anyway, the problem is the same, since DBSCAN requires Epsilon..Rackrent
The DBSCAN authors suggest to use a k-distance plot to find an appropriate epsilon value, btw. If you require different values of epsilon, the full answer is: use OPTICS!Aguayo
@Anony-Mousse Ok, thank you! So, do you know a java library which implements OPTICS algorithm? Thank you very muchRackrent

© 2022 - 2024 — McMap. All rights reserved.