Logarithmic scale in material google line chart
Asked Answered
L

2

6

I am not able to create a logarithmic vertical axis for my material Google Line Chart. Documentation states that I should set vAxis.logScale to true in the options, but this leads to no result.

Currently my test reads:

<div class="chart"></div>

<script src="https://ajax.googleapis.com/ajax/libs/jquery/2.1.4/jquery.min.js"></script>
<script src="https://www.gstatic.com/charts/loader.js"></script>
<script>
    google.charts.load("current", { "packages": [ "line", "corechart" ]});
    google.charts.setOnLoadCallback(function() {
        var data = new google.visualization.DataTable();
        data.addColumn("date", "Date");
        data.addColumn("number", "1");
        data.addColumn("number", "2");

        data.addRows([
            [ new Date(2016, 0, 27), 684130172, -1 ], [ new Date(2016, 0, 28), 684189642, -1 ], [ new Date(2016, 0, 29), 684837381, 122895 ], [ new Date(2016, 0, 30), 685595817, 238244 ], [ new Date(2016, 0, 31), 686690845, 239450 ], [ new Date(2016, 1, 1), 688391639, 536141 ], [ new Date(2016, 1, 2), 691181274, 1651530 ], [ new Date(2016, 1, 3), 693040518, 1698813 ], [ new Date(2016, 1, 4), 694335907, 2271617 ], [ new Date(2016, 1, 5), 694978502, 2314718 ], [ new Date(2016, 1, 6), 696142818, 2314758 ], [ new Date(2016, 1, 7), 698869181, 3234042 ], [ new Date(2016, 1, 8), 700446296, 3338104 ], [ new Date(2016, 1, 9), 705552668, 6175539 ], [ new Date(2016, 1, 10), 707540295, 6812427 ], [ new Date(2016, 1, 11), 707766077, 6831641 ], [ new Date(2016, 1, 12), 707922926, 6839607 ], [ new Date(2016, 1, 13), 708061736, 6883806 ], [ new Date(2016, 1, 14), 713986011, 10366780 ], [ new Date(2016, 1, 15), 717491978, 12527120 ], [ new Date(2016, 1, 16), 719057078, 12794871 ], [ new Date(2016, 1, 17), 723813184, 14959625 ],      ]);

        var chart = new google.charts.Line($(".chart")[0]);
        chart.draw(data, {
            chart: {
                title: "History for ..."
            },
            height: 400,
            width: 800,
            vAxis: {
                logScale: true,
                minValue: 0
            }
        });
    });
</script>

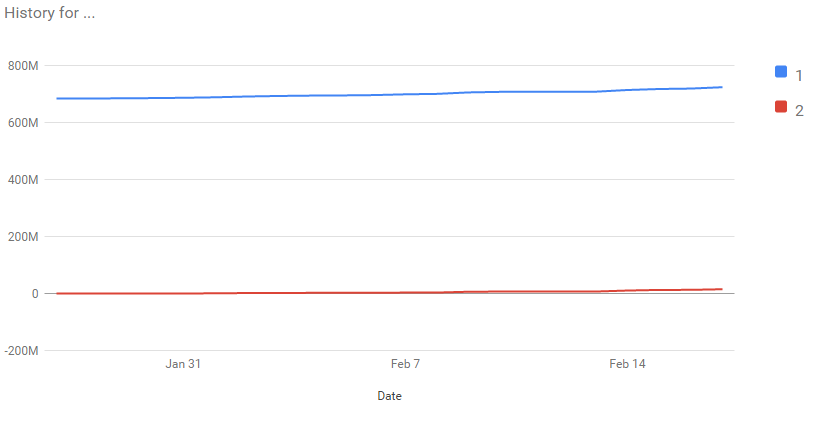
And produces:

Chart result

I have used a lot of combinations of options but I haven't yet produced any logarithmic result.

Louielouis answered 17/2, 2016 at 23:8 Comment(9)
probably won't help but have you tried google.charts.Line.convertOptions for 'material' options?Electrolytic
Thanks for the suggestion. I tried it but it didn't work. I checked and it did convert the title if I put it in as title instad of chart.title, so it did work. Speaking of chart.title, I can't see that one documented either. Is there a resource I'm missing?Louielouis
it's listed in the configuration options for a column chart but I haven't found an overall listing...Electrolytic
@Bharata, even though your answer adds some information, the issue was already solved by my answer 2 hours previously. I do agree that the last answer was unusually/artificially upvoted and contains nothing new.Pistil
@RSchifini, I have another opinion for this situation: you can not say that this issue was already solved because you do not know what for information the bounty owner and OP need. I think that bounty owner has to decide it.Seadon
@RSchifini, and I wrote already one answer about Google Charts. So, you can see that I had already knowledge about this before I have answered.Seadon
@R.Schifini Your answer does not solve the problem as it is simply a dump of code that works for you without any explanation as to why it does. Bharata's answer actually helps me understand the problem in the first place. Please keep in mind that we're here to help out everyone with a similar problem, not just to fix my code example.Louielouis
@Villermen, the answer I gave not only works for me, it simply works for everyone. As to why it works, it is clear that you were not using the correct method, so a simple correction was needed. And lastly, thank you for reminding me that we are here to help! I always forget that when answering questions!Pistil
@Seadon is you suspect voting fraud raise a mod flag, don't write a public comment, as you may be wrong.Diminished
S
3

The reason that these features are not working is because the 'line' package that you are loading and the google.charts.Line(...) object that you are using are creating what Google calls a Material Chart.

This is a completely redesigned implementation of the Google Visualization API adhering to Google's "Material Design" specification and is still currently in beta (see details here).

A lot of the features found in what they call the "Classic" chart library have not yet been carried over to the "Material Design" charts (see this Github issue).

You can solve your issue by using the older (but much better supported) Google Visualization "Classic" corechart package. In this case you have to replace only one line in your code. Instead of:

var chart = new google.charts.Line($(".chart")[0]);

you have to write this line:

var chart = new google.visualization.LineChart($(".chart")[0]);

Or, if you do not want to use jQuery (you do not need it) then replace it with this line:

var chart = new google.visualization.LineChart(document.querySelector(".chart"));

and delete jQuery calling.

Complete solution

google.charts.load("current", {"packages": ["line", "corechart"]});
google.charts.setOnLoadCallback(function()
{
    var data = new google.visualization.DataTable();
    data.addColumn("date", "Date");
    data.addColumn("number", "1");
    data.addColumn("number", "2");

    data.addRows(
    [
        [new Date(2016, 0, 27), 684130172, -1],
        [new Date(2016, 0, 28), 684189642, -1],
        [new Date(2016, 0, 29), 684837381, 122895],
        [new Date(2016, 0, 30), 685595817, 238244],
        [new Date(2016, 0, 31), 686690845, 239450],
        [new Date(2016, 1, 1), 688391639, 536141],
        [new Date(2016, 1, 2), 691181274, 1651530],
        [new Date(2016, 1, 3), 693040518, 1698813],
        [new Date(2016, 1, 4), 694335907, 2271617],
        [new Date(2016, 1, 5), 694978502, 2314718],
        [new Date(2016, 1, 6), 696142818, 2314758],
        [new Date(2016, 1, 7), 698869181, 3234042],
        [new Date(2016, 1, 8), 700446296, 3338104],
        [new Date(2016, 1, 9), 705552668, 6175539],
        [new Date(2016, 1, 10), 707540295, 6812427],
        [new Date(2016, 1, 11), 707766077, 6831641],
        [new Date(2016, 1, 12), 707922926, 6839607],
        [new Date(2016, 1, 13), 708061736, 6883806],
        [new Date(2016, 1, 14), 713986011, 10366780],
        [new Date(2016, 1, 15), 717491978, 12527120],
        [new Date(2016, 1, 16), 719057078, 12794871],
        [new Date(2016, 1, 17), 723813184, 14959625]
    ]);

    //var chart = new google.charts.Line($(".chart")[0]);
    var chart = new google.visualization.LineChart(document.querySelector(".chart"));
    chart.draw(data,
    {
        chart: {title: "History for ..."},
        height: 400,
        width: 800,
        vAxis:
        {
            logScale: true,
            minValue: 0
        }
    });
});
<div class="chart"></div>
<!-- <script src="https://ajax.googleapis.com/ajax/libs/jquery/2.1.4/jquery.min.js"></script> -->
<script src="https://www.gstatic.com/charts/loader.js"></script>
Seadon answered 12/9, 2018 at 23:51 Comment(1)
I'm marking this as the answer as it is more detailed and gives an explanation for why my approach did not work. Keep in mind that switching to the older visualization type has its drawbacks. You will have to switch some properties around (E.g., chart.title -> title) and in my opinion the old charts have a more dated look. Still it achieves what I'm looking for with some minor drawbacks.Louielouis
P
3

Is this what you need?

This is the only change needed:

var chart = new google.visualization.LineChart($(".chart")[0]);

Here are the interactive docs with links to JSFiddle examples

<div class="chart"></div>

<script src="https://ajax.googleapis.com/ajax/libs/jquery/2.1.4/jquery.min.js"></script>
<script src="https://www.gstatic.com/charts/loader.js"></script>
<script>
    google.charts.load("current", { "packages": [ "line", "corechart" ]});
    google.charts.setOnLoadCallback(function() {
        var data = new google.visualization.DataTable();
        data.addColumn("date", "Date");
        data.addColumn("number", "1");
        data.addColumn("number", "2");

        data.addRows([
            [ new Date(2016, 0, 27), 684130172, -1 ], [ new Date(2016, 0, 28), 684189642, -1 ], [ new Date(2016, 0, 29), 684837381, 122895 ], [ new Date(2016, 0, 30), 685595817, 238244 ], [ new Date(2016, 0, 31), 686690845, 239450 ], [ new Date(2016, 1, 1), 688391639, 536141 ], [ new Date(2016, 1, 2), 691181274, 1651530 ], [ new Date(2016, 1, 3), 693040518, 1698813 ], [ new Date(2016, 1, 4), 694335907, 2271617 ], [ new Date(2016, 1, 5), 694978502, 2314718 ], [ new Date(2016, 1, 6), 696142818, 2314758 ], [ new Date(2016, 1, 7), 698869181, 3234042 ], [ new Date(2016, 1, 8), 700446296, 3338104 ], [ new Date(2016, 1, 9), 705552668, 6175539 ], [ new Date(2016, 1, 10), 707540295, 6812427 ], [ new Date(2016, 1, 11), 707766077, 6831641 ], [ new Date(2016, 1, 12), 707922926, 6839607 ], [ new Date(2016, 1, 13), 708061736, 6883806 ], [ new Date(2016, 1, 14), 713986011, 10366780 ], [ new Date(2016, 1, 15), 717491978, 12527120 ], [ new Date(2016, 1, 16), 719057078, 12794871 ], [ new Date(2016, 1, 17), 723813184, 14959625 ],      ]);

        var chart = new google.visualization.LineChart($(".chart")[0]);
        chart.draw(data, {
            chart: {
                title: "History for ..."
            },
            height: 400,
            width: 800,
            vAxis: {
                logScale: true,
                minValue: 0
            }
        });
    });
</script>
Pistil answered 12/9, 2018 at 21:55 Comment(1)
So much appreciated. I had tried that before, but didn't realise the older chart API didn't like minValue and maxValue in options.hAxis for some reason. "a.getTime is not a function" Your example spurred me to retry and it works now.Japha
S
3

The reason that these features are not working is because the 'line' package that you are loading and the google.charts.Line(...) object that you are using are creating what Google calls a Material Chart.

This is a completely redesigned implementation of the Google Visualization API adhering to Google's "Material Design" specification and is still currently in beta (see details here).

A lot of the features found in what they call the "Classic" chart library have not yet been carried over to the "Material Design" charts (see this Github issue).

You can solve your issue by using the older (but much better supported) Google Visualization "Classic" corechart package. In this case you have to replace only one line in your code. Instead of:

var chart = new google.charts.Line($(".chart")[0]);

you have to write this line:

var chart = new google.visualization.LineChart($(".chart")[0]);

Or, if you do not want to use jQuery (you do not need it) then replace it with this line:

var chart = new google.visualization.LineChart(document.querySelector(".chart"));

and delete jQuery calling.

Complete solution

google.charts.load("current", {"packages": ["line", "corechart"]});
google.charts.setOnLoadCallback(function()
{
    var data = new google.visualization.DataTable();
    data.addColumn("date", "Date");
    data.addColumn("number", "1");
    data.addColumn("number", "2");

    data.addRows(
    [
        [new Date(2016, 0, 27), 684130172, -1],
        [new Date(2016, 0, 28), 684189642, -1],
        [new Date(2016, 0, 29), 684837381, 122895],
        [new Date(2016, 0, 30), 685595817, 238244],
        [new Date(2016, 0, 31), 686690845, 239450],
        [new Date(2016, 1, 1), 688391639, 536141],
        [new Date(2016, 1, 2), 691181274, 1651530],
        [new Date(2016, 1, 3), 693040518, 1698813],
        [new Date(2016, 1, 4), 694335907, 2271617],
        [new Date(2016, 1, 5), 694978502, 2314718],
        [new Date(2016, 1, 6), 696142818, 2314758],
        [new Date(2016, 1, 7), 698869181, 3234042],
        [new Date(2016, 1, 8), 700446296, 3338104],
        [new Date(2016, 1, 9), 705552668, 6175539],
        [new Date(2016, 1, 10), 707540295, 6812427],
        [new Date(2016, 1, 11), 707766077, 6831641],
        [new Date(2016, 1, 12), 707922926, 6839607],
        [new Date(2016, 1, 13), 708061736, 6883806],
        [new Date(2016, 1, 14), 713986011, 10366780],
        [new Date(2016, 1, 15), 717491978, 12527120],
        [new Date(2016, 1, 16), 719057078, 12794871],
        [new Date(2016, 1, 17), 723813184, 14959625]
    ]);

    //var chart = new google.charts.Line($(".chart")[0]);
    var chart = new google.visualization.LineChart(document.querySelector(".chart"));
    chart.draw(data,
    {
        chart: {title: "History for ..."},
        height: 400,
        width: 800,
        vAxis:
        {
            logScale: true,
            minValue: 0
        }
    });
});
<div class="chart"></div>
<!-- <script src="https://ajax.googleapis.com/ajax/libs/jquery/2.1.4/jquery.min.js"></script> -->
<script src="https://www.gstatic.com/charts/loader.js"></script>
Seadon answered 12/9, 2018 at 23:51 Comment(1)
I'm marking this as the answer as it is more detailed and gives an explanation for why my approach did not work. Keep in mind that switching to the older visualization type has its drawbacks. You will have to switch some properties around (E.g., chart.title -> title) and in my opinion the old charts have a more dated look. Still it achieves what I'm looking for with some minor drawbacks.Louielouis

© 2022 - 2024 — McMap. All rights reserved.