I am really pretty new to matplotlib, though I know that it can be very powerful.
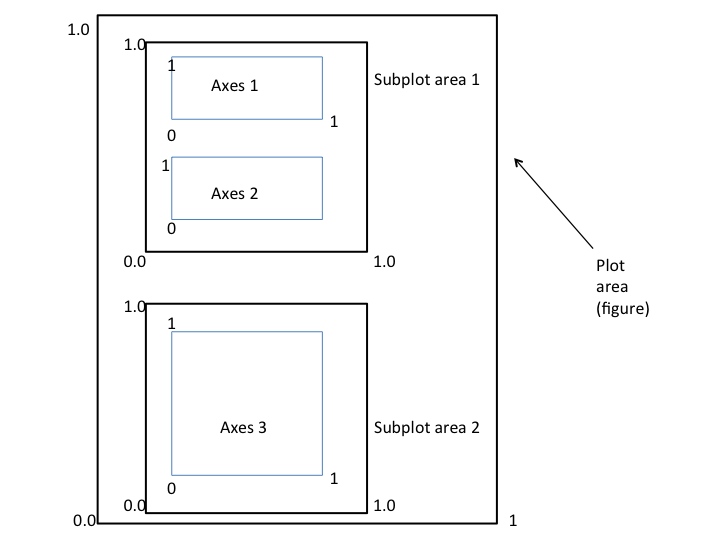
I've been reading number of tutorials and examples and it's a real hassle to understand how does matplotlib's Figure and Axes work. I am illustrating, what I am trying to understand, with the attached figure.
I know how to create a figure instance of certain size in inches. However, what bothers me is how can I create subplots and then axes, within each subplot, with relative coordinates (bottom=0,left=0,top=1,right=1) as illustrated.
So, for example I want to create a "parent" plot area (say (6in,10in)). Then, I want to create two subplot areas, each with size (3in,3in), with 1in space from the top, 2in space between the two vertical subplot areas and 1in from bottom. Then, 1in space on the left and 2in space on the write. In the same time, I would like to be able to get the coordinates of the subplot areas with respect to the main plot area.
Then, inside the first subplot area, I'd like to create 2 axis instances, with Axis 1, having coordinates with respect to Subplot Area1 (0.1,0.7,0.7,0.2) and Axes 2 (0.1,0.2,0.7,0.5). And then of course I'd like to be able to plot on these axes e.g., ax1.plot()....
If you could provide a sample code to achieve that, then I can study it.
Your help will be very much appreciated!

subplotand anAxesobject are really the same thing. There is not really a "subplot" as you describe it in matplotlib. You can just create your threeAxesobjects usinggridspecwithout the need to put them in your "subplots" – NelsonnemaAxesandsubplot, when they are the same thing? – Mrafig.add_subplotreturns anAxesinstance.subplotis not a class, it is a function that returns an Axes. – Nelsonnemafig.add_subplotandfig.add_axes? – Mra