Windows CPU Scheduler - very high kernel time [closed]
Asked Answered
F

1

6

We are trying to understand how Windows CPU Scheduler works in order to optimize our applications to achieve maximum possible infrastructure/real work ratio. There's some things in xperf that we don't understand and would like to ask the community to shed some light on what's really happening. We initially started to investigate these issues when we got reports that some servers were "slow" or "unresponsive".

Background information

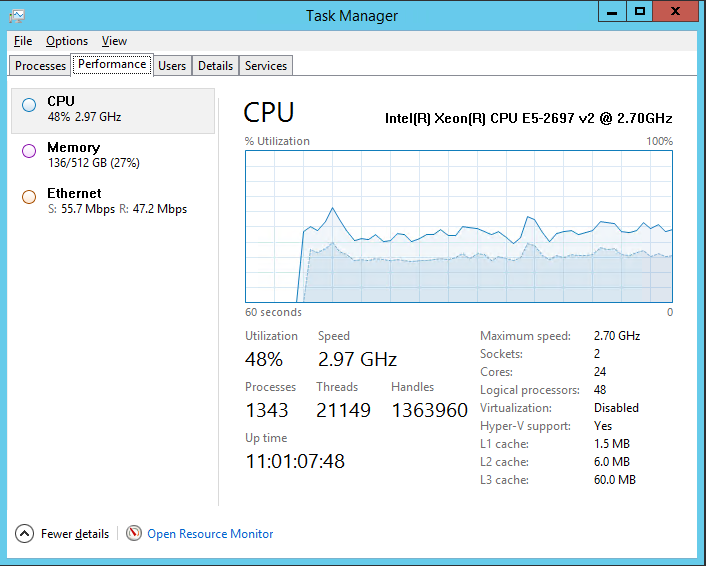
We have a Windows 2012 R2 Server that runs our middleware infrastructure with the following specs.

We found concerning that 30% of CPU is getting wasted on kernel, so we started to dig deeper.

task manager view

The server above runs "host" ~500 processes (as windows services), each of these "host" processes has an inner while loop with a ~250 ms delay (yuck!), and each of those "host" processes may have ~1..2 "child" processes that are executing the actual work.

While having the infinite loop with 250 ms delay between iterations, the actual useful work for the "host" application to execute may appear only every 10..15 seconds. So there's a lot of cycles wasted for unnecessary looping.

We are aware that design of the "host" application is sub-optimal, to say the least, as applied to our scenario. The application is getting changed to an event-based model which will not require the loop and therefore we expect a significant reduction of "kernel" time in CPU utilization graph.

However, while we were investigating this problem, we've done some xperf analysis which raised several general questions about Windows CPU Scheduler for which we were unable to find any clear/concise explanation.

What we don't understand

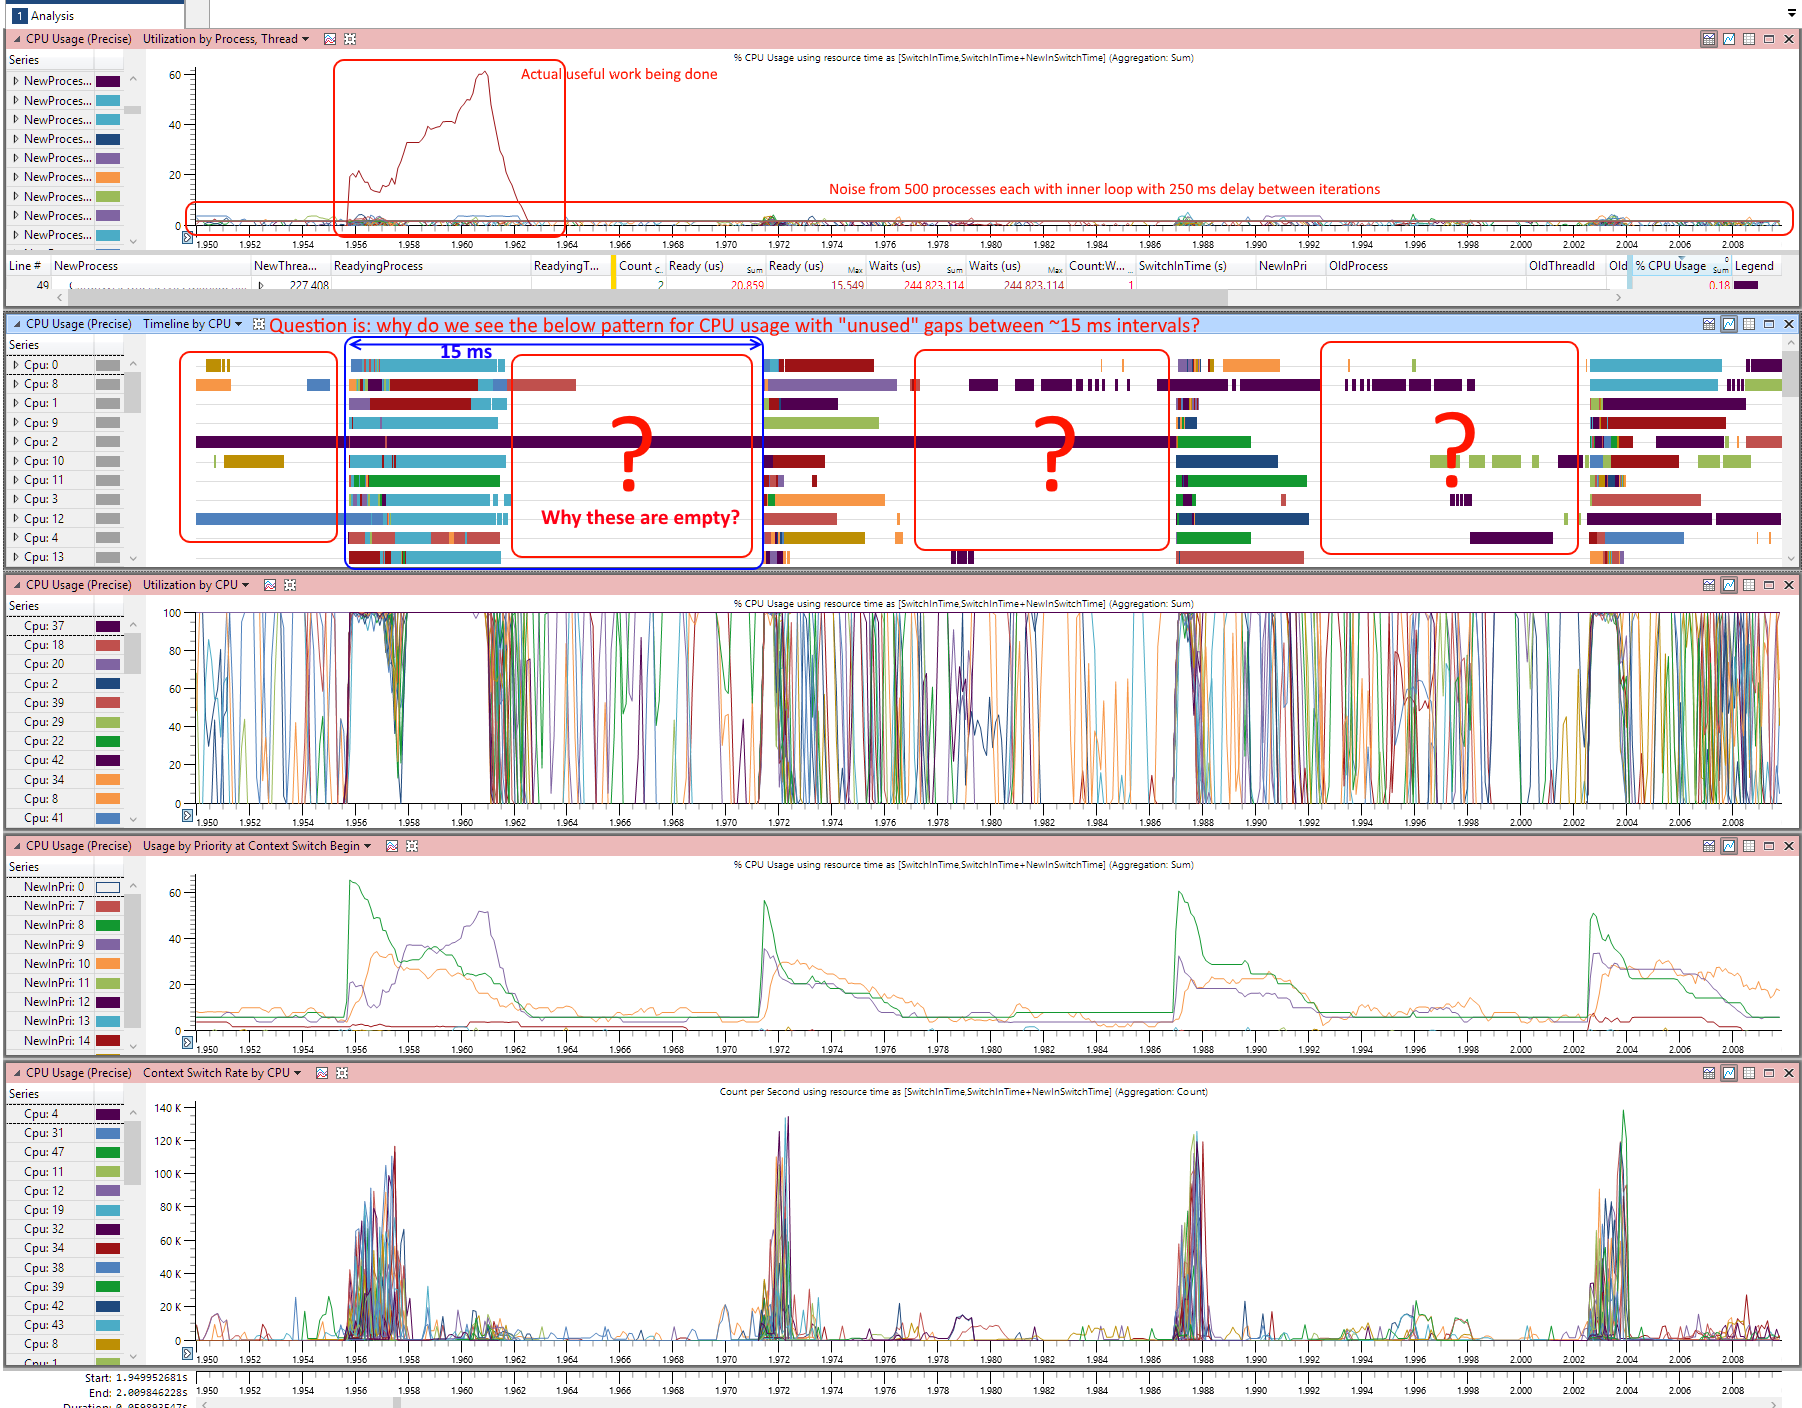
Below is the screenshot from one of xperf sessions.

xperf session

You can see from the "CPU Usage (Precise)" that

  • There's 15 ms time slices, of which majority are under-utilized. The utilization of those slices is ~35-40%. So I assume that this in turn means that CPU gets utilized about ~35-40% of the time, yet the system's performance (let's say observable through casual tinkering around the system) is really sluggish.

  • With this we have this "mysterious" 30% kernel time cost, judged by the task manager CPU utilization graph.

  • Some CPU's are obviously utilized for the whole 15 ms slice and beyond.

Questions

As far as Windows CPU Scheduling on multiprocessor systems is concerned:

  • What causes 30% kernel cost? Context switching? Something else? What consideration should be made when applications are written to reduce this cost? Or even - achieve perfect utilization with minimal infrastructure cost (on multiprocessor systems, where number of processes is higher than the number of cores)
    • What are these 15 ms slices?
    • Why CPU utilization has gaps in these slices?
Flavine answered 20/4, 2016 at 3:5 Comment(9)
This is a Question and Answer site, which means one specific question per post as a general rule. A couple of related questions might be acceptable in some cases. Six questions about such a broad scope that is OS related and not code related is really pushing things. MS has documented the scheduler's design, and it's been discussed on many MS blog posts. None of what you''ve asked is related to programming in any specific sense, other than programs run on the OS.Sanctum
You don't write software in isolation from the operating system.Flavine
It depends a lot what the "working" processes are actually doing. If there isn't a lot of heavy CPU work (if you're mostly waiting for I/O or something) then idle CPU is to be expected. Similarly, if most of your time is spent making OS calls - particularly the idle loops - 30% kernel time doesn't seem unreasonable. For optimum performance you need far fewer processes. Preferably just one. You don't say whether you're creating the worker processes on the fly, but if so, you should note that launching a process is really slow.Fillmore
Working processes are re-used, hence if a "host" application has a "worker" child process, it will re-use it for as long as there's work available, and then wait for ~5 minutes for the new work to come, if the new work does not come, the process will be shut down. However in reality "worker" processes just stay there as "hosts" have enough work to keep them "alive". Worker processes execute stuff that is a mix of Query->Process->Submit, so there is some IO on the external service (SQL). In case of a loop, what part of it constitutes to kernel consumption?Flavine
My question is more about what process/thread behavior could cause high kernel CPU consumption? And why? It looks to me that there's some "fixed" switching cost, and if we have too many processes/threads that are active, the OS just gets burned down by constantly switching, and assuming that the switch cost is fixed, this scales with the number of switches necessary which in turn depends on the number of active processes/threads. And what's with those underutilized 15ms "quanta" periods?Flavine
I would guess that every 15ms, a bunch of processes wake up from the call to Sleep(), check for work, don't find any, and go back to sleep. Looks like that only takes 5-7ms, so if there are no other processes ready to run, the core goes idle until the next clock tick. I'm not sure what the significance of the different colours in that chart are, though, so perhaps that interpretation doesn't make sense.Fillmore
Note that switching between processes is expensive, much more so than switching between threads, because the CPU page tables have to be reloaded. That's bound to result in a fixed kernel-mode overhead, but I have no quantitative data on it. (Approximately 55 processes per physical core doesn't sound too bad to me, but I lack the experience to make a sound judgement on that. All I can say for sure is that it isn't optimal.) [Perhaps in this scenario there's too much contention for whatever memory structures the scheduler uses?]Fillmore
FWIW, I could give an answer, but since the question is closed it's not really worth it. In short: CPU Usage (sampled) will tell you where you're spending time in the kernel - note that this is probably affected by ETW profiling, and is probably not important. Finding why the CPUs go idle is covered here: randomascii.wordpress.com/2012/05/05/… Oops, I guess I gave a complete answer.Deca
Thank you Bruce. I can tell you one thing - your blog on xperf is the best out there for this topic and your materials helped me a lot on a countless occasions. BIG thanks for your efforts!Flavine
T
6

To diag the CPU usage issues, you should use Event Tracing for Windows (ETW) to capture CPU Sampling data (not precise, this is useful to detect hangs).

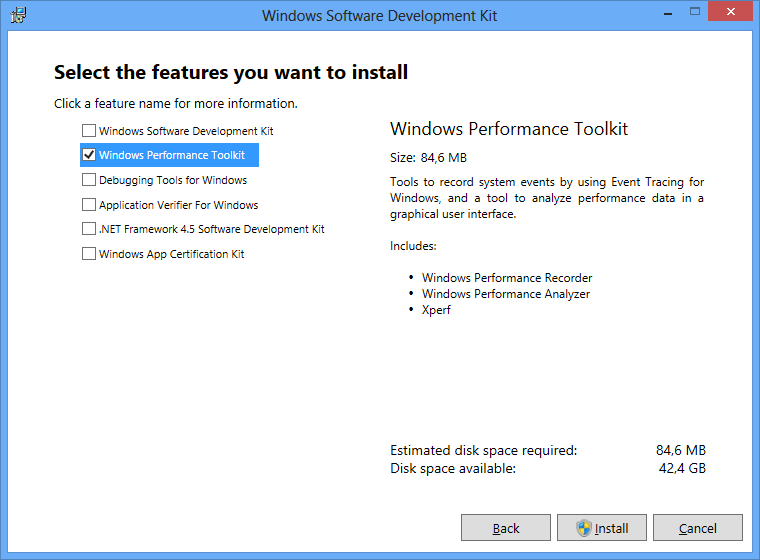
To capture the data, install the Windows Performance Toolkit, which is part of the Windows SDK.

enter image description here

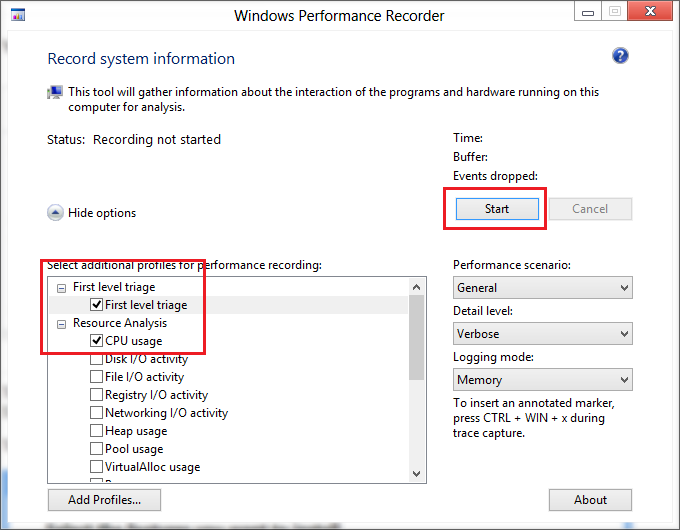
Now run WPRUI.exe, select First Level, under Resource select CPU usage and click on start.

enter image description here

Now capture 1 minute of the CPU usage. After 1 minute click on Save.

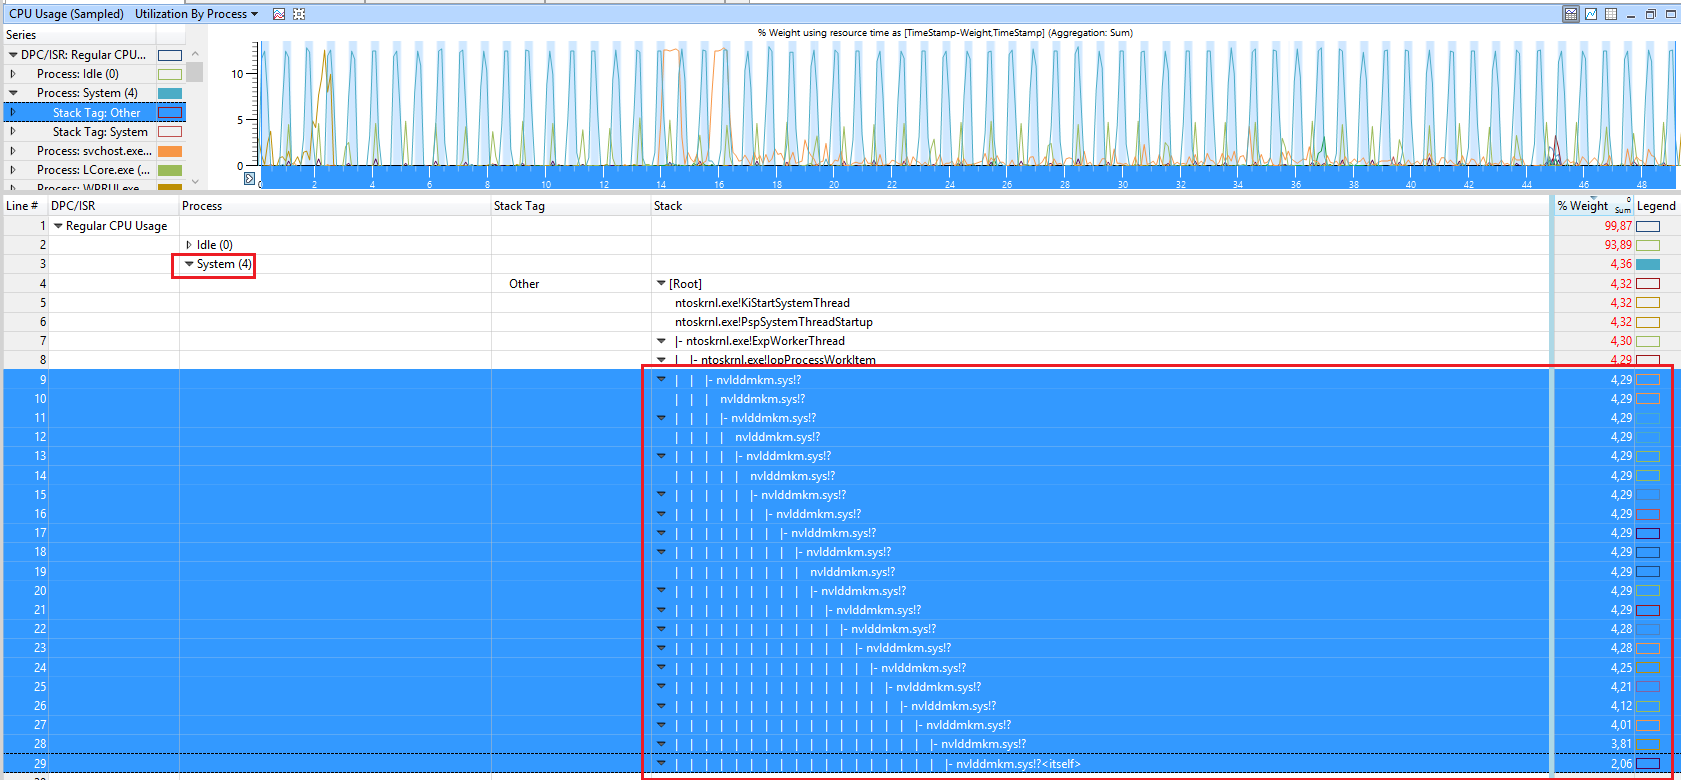
Now analyze the generated ETL file with the Windows Performance Analyzer by drag & drop the CPU Usage (sampled) graph to the analysis pane and order the colums like you see in the picture:

enter image description here

Inside WPA, load the debug symbols and expand Stack of the SYSTEM process. In this demo, the CPU usage comes from the nVIDIA driver.

Tulipwood answered 20/4, 2016 at 3:53 Comment(3)
Thanks. I have the "CPU Simple" trace as well, however I don't see what could have caused this high kernel CPU usage. :(Flavine
share the ETL (zipped to reduce the size) on OneDrive and post a link here. I'll take a look at itTulipwood
looks like you can't share it. Or have I missed a 2nd mail?Tulipwood

© 2022 - 2024 — McMap. All rights reserved.