I have created an extensive theme to plot in ggplot similar to Five Thirty Eight. Without using ggthemes, how can I utilize linesGrob to draw a line above my footer that is centered and goes 85% of the way across the plot without touching the edges of the plot? I am striving for the footer similar to this plot. 
I can edit the font text, color, and size so don't worry about that.
So far, what I have is this:
data(iris)

library(ggplot2)
library(grid)
library(gridExtra)

plot20 <- ggplot(iris,aes(x=Petal.Length,y=Sepal.Length,color=Species)) +
  geom_point(alpha=0.5,size=5) +
  ylab("") +
  xlab("") +
  theme(panel.grid.minor.y=element_blank(),
        panel.grid.major.x=element_line(color="#D2D2D2",size=0.7),
        panel.grid.major.y=element_line(color="#D2D2D2",size=0.7),
        panel.grid.minor.x=element_blank(),
        panel.background = element_rect(fill = '#F0F0F0',colour=NA),
        plot.background = element_rect(fill = '#F0F0F0', colour=NA, size = 4),
        legend.background=element_rect(fill="#F0F0F0"),
        legend.key=element_blank(),
        legend.title=element_text(face="bold"),
        axis.text=element_text(face="bold"),
        legend.position="none",
        axis.ticks=element_blank())

#Plot Header
my_g2 <- grobTree(rectGrob(gp=gpar(fill='#F0F0F0',col=NA)),
                  textGrob("Iris Dataset",x=0.115, vjust = -0.5,gp=gpar(fontsize=18,fontface="bold")),
                  textGrob("This is a subheader for the iris dataset",x=0.235,vjust=1.5,gp=gpar(fontsize=14)))

#Plot Footer
my_g1 <- grobTree(rectGrob(gp=gpar(fill="#F0F0F0",col=NA)),
                  textGrob("    medavis6",x=0,hjust=0,gp=gpar(col="darkorange",fontsize=8,fontface="bold")),
                  textGrob("Source: R",x=.85,hjust=-1.06,gp=gpar(col="black",fontsize=8)))

#Plot All Together
allplot <- grid.arrange(my_g2,plot20,my_g1,heights=c(1.17,11,0.5))
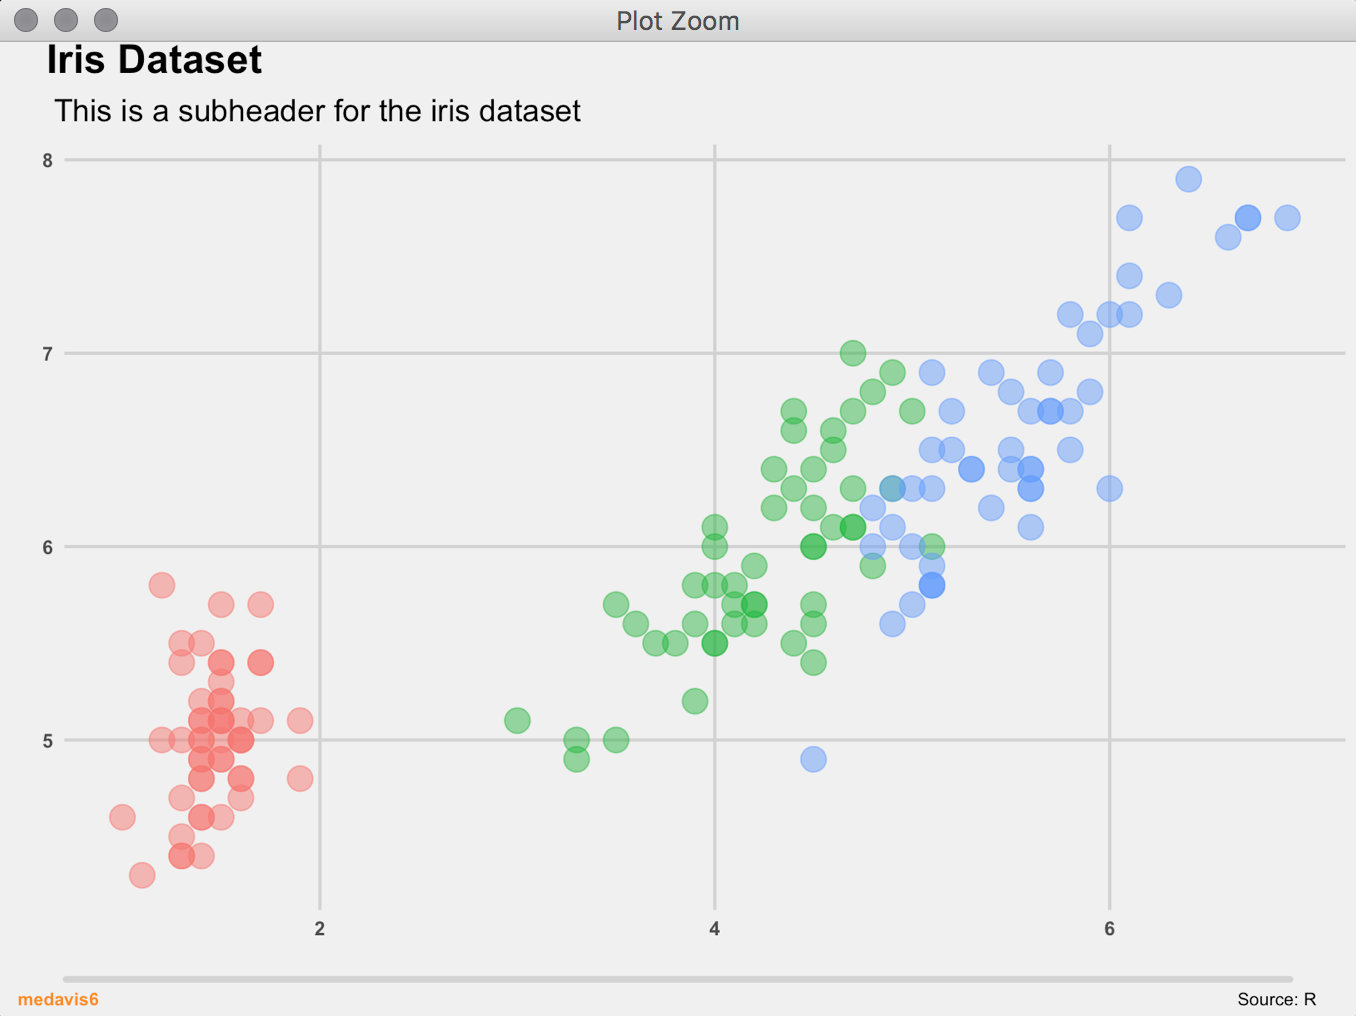
Which gives me this.
I think I should be using linesGrob() within my footer grobTree(), but whenever I try to do it I cannot make it appear in my plots. I'm not sure if my rectGrob() is plotting over the top of it or what is happening.
Thanks for any and all help and please, let me know if you need any clarification. Also, if any of my code is poorly written, I'm always looking for constructive criticism to make it better!


