How to change Stargazer HTML table width?
Asked Answered
B

2

6

I really like the styling of tables that the stargazer package uses. The tables render fine in pdf using Knitr and Rstudio. However when I try to knit my .Rmd into an html page, the tables end up squished together. Chunk option fig.width does not help, nor does the stargazer option column.sep.width. Is there any way to change the table width or is there another workflow to get pretty summary tables in html?

Reproducible example:

{r test, results = "asis"}

stargazer::stargazer(attitude,
                 type = "html",
                 digits = 2,
                 summary.stat = c("mean","sd","median","min", "max"))

Latex rendering

HTML rendering

Bask answered 16/9, 2016 at 17:52 Comment(3)
Would you consider adding protected whitespace ( ) around the column names an acceptable solution?Gunpowder
Possible duplicate question (although without solution).Bartholomeo
Just posted a CSS based solution in this similar questionHeaney
S
5

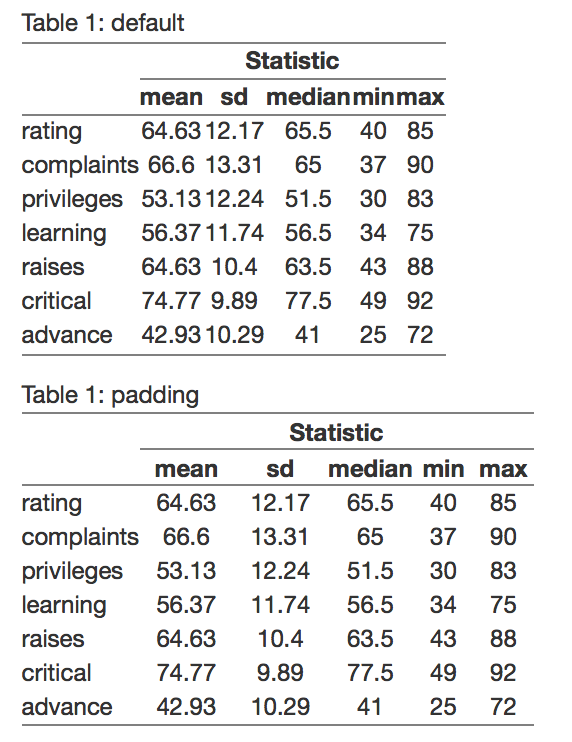
I am heavily biased towards htmlTable::htmlTable, but I will add this anyway. htmlTable, as the name would suggest, is only for making tables, so all the bells and whistles of stargazer are not included, but this function has many options for customizing the output. As such you may need to do extra work to get the output you need to put into a table.

Similar to the other answer, you can use css to manipulate the style of the table. For example, you can pass css to css.cell:

---
output: html_document
---

```{r test, results='asis', include=FALSE}
stargazer::stargazer(attitude,
                 type = "html",
                 digits = 2,
                 summary.stat = c("mean","sd","median","min", "max"))
```

```{r}
## apply a list of functions to a list or vector
f <- function(X, FUN, ...) {
  fn <- as.character(match.call()$FUN)[-1]
  out <- sapply(FUN, mapply, X, ...)
  setNames(as.data.frame(out), fn)
}

(out <- round(f(attitude, list(mean, sd, median, min, max)), 2))
```

```{r, results='asis'}
library('htmlTable')
htmlTable(out,  cgroup = 'Statistic', n.cgroup = 5, caption = 'Table 1: default')

htmlTable(out, cgroup = 'Statistic', n.cgroup = 5, caption = 'Table 1: padding',
          ## padding to cells: top side bottom
          css.cell = 'padding: 0px 10px 0px;')
```

The following tables for no padding and extra padding on the sides

enter image description here

Steviestevy answered 16/9, 2016 at 21:35 Comment(0)
B
1

Try going into the actual HTML in the file after you create it. There will be a table tag that establishes the style, width, and so on. For example, if the table tag is <table style="text-align:center"> set the width manually as <table style="text-align:center" width="3000">

Byrd answered 16/9, 2016 at 18:14 Comment(0)

© 2022 - 2024 — McMap. All rights reserved.