How to add subscripts to ggplot2 axis.text
Asked Answered
T

1

6

I want to use subscripts within each factor in a ggplot barplot.

d = structure(list(env = structure(c(1L, 3L, 4L, 2L, 5L, 7L, 6L), .Label = c("mean SS", 
"50% O2 @ 25 °C", "50% O2 @ 0 °C", "50% O2 @ 10 °C", "anoxic @ 0 °C", 
"anoxic @ 25 °C", "anoxic @ 10 °C"), class = "factor"), pco2_inc = c(60, 
138.652445968464, 144.328210839879, 112.560395996095, 173.615572249453, 
234.86228704132, 209.102964222973)), class = "data.frame", row.names = c(NA, 
-7L))

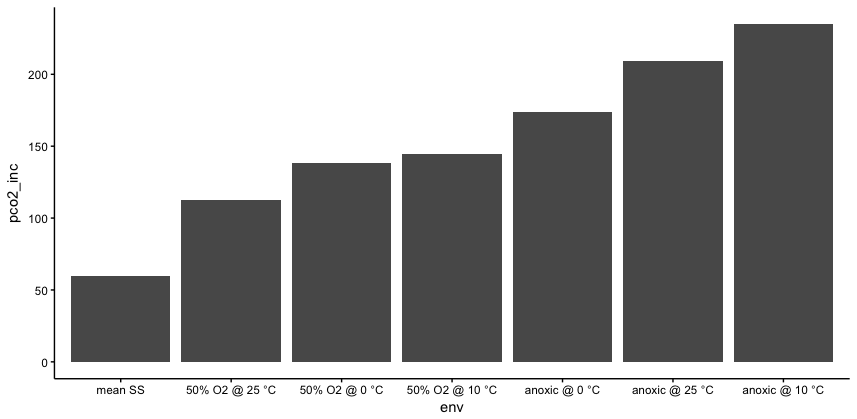
Given the data.frame above, I want to produce a plot like this:

ggplot(d, aes(env, pco2_inc)) + geom_col()

plot

How can I make the 2 in O2 subscripted for all the bar labels?

I've seen how the entire x axis label can be changed:

labs(x = expression(paste('50% ', O[2], ' @ 0 °C')))

but can't find how to get the axis.text to work.

Trim answered 25/5, 2018 at 4:45 Comment(0)
T
6

One option is to turn the env strings into valid plotmath expressions, so that they can be parsed properly. The code below takes care of that, though I'd be surprised if there isn't a more elegant approach.

library(tidyverse)

d = d %>%
  arrange(pco2_inc) %>% 
  mutate(env=gsub("O2", "O[2]", env),
         env=gsub(" ", "~", env),
         env=gsub("@", "'@'", env),
         env=gsub("%", "*'%'", env),
         env=gsub("~°", "*degree*", env))
                          env pco2_inc
1                     mean~SS  60.0000
2 50*'%'~O[2]~'@'~25*degree*C 112.5604
3  50*'%'~O[2]~'@'~0*degree*C 138.6524
4 50*'%'~O[2]~'@'~10*degree*C 144.3282
5       anoxic~'@'~0*degree*C 173.6156
6      anoxic~'@'~25*degree*C 209.1030
7      anoxic~'@'~10*degree*C 234.8623
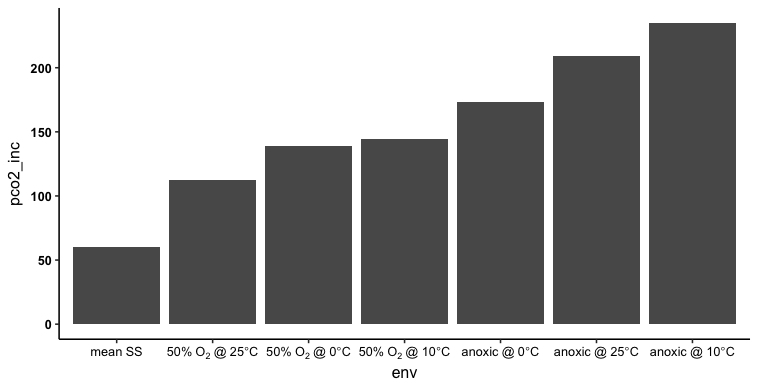
ggplot(d, aes(reorder(env, pco2_inc), pco2_inc)) + geom_col() + 
  scale_x_discrete(labels=parse(text=unique(d$env))) +
  theme_classic(base_size=12) +
  theme(axis.text=element_text(colour="black", face="bold")) +
  labs(x="env")

enter image description here

Tutorial answered 25/5, 2018 at 5:32 Comment(5)
When I run this code with a fresh session I am getting an error: Error in grid.Call(C_textBounds, as.graphicsAnnot(x$label), x$x, x$y, : polygon edge not found Trim
That happened to me a few times when I was working on this answer. It seems to be font-related. I found that if I ran the code a few times, the plot eventually rendered. I haven't tried to resolve the underlying font issue yet.Tutorial
Thanks! Any idea how I can also incorporate a line break into this too? I'm trying to figure it out but can't find the magic combo of quotes, slashes, and \ns.Trim
I don't think you can have a line break in a plotmath expression. Check out the atop function for two-line expressions.Tutorial
Thanks. I figured out how to do it manually which should work as long as I don't forget to make changes when the data change! :/Trim

© 2022 - 2024 — McMap. All rights reserved.