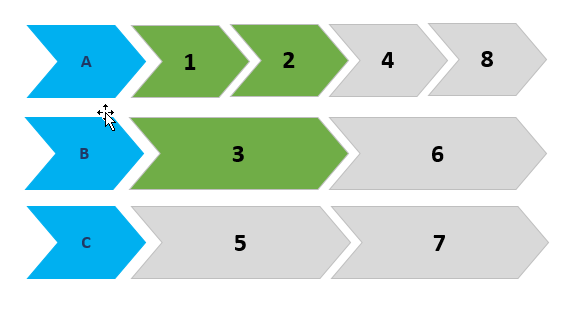
I did not find an existing solution for this, so I wrote a function which does what you need. Of course, it will give inappropriate results for big datasets.
require(dplyr)
timeline_plot <- function(dat, spacing = 0.01, team_size = 0.25, notch = 0.1,
                          cols = list(team = "lightblue",
                                      completed = "green3",
                                      "to do" = "lightgray"),
                          cex_label = 2){
  # Arguments:
  # dat = data frame
  # spacing = space between polygons (part of plot width)
  # team_size = size of team polygon (part of plot width)
  # notch = size of arrow side protruding (part of plot width)
  # cols = color for each status
  # cex_lab = cex of labels


  # Count number of columns
  dat_n <- dat %>%
    group_by(team) %>%
    summarise(n = length(team))

  # Get number of rows
  nr <- length(dat_n$team)

  # Prepare polygon
  poly <- matrix(c(0, 0, 0, 1, 1, 1, 0, 0.5, 1, 1, 0.5, 0), ncol = 2)

  # Function for polygon scaling, shifting and notch adding
  morph_poly <- function(poly, scale_x = 1, shift_x = 0, notch){
    poly[, 1] <- poly[, 1] * scale_x + shift_x
    poly[c(2, 5), 1] <- poly[c(2, 5), 1] + notch
    return(poly)
  }

  # Fucntion for label positioning
  label_pos_x <- function(poly){
    x <- poly[2, 1] + (poly[5, 1] - poly[2, 1]) / 3
    return(x)
  }

  # Save old par
  opar <- par()

  # Set number of rows for plotting
  par(mfrow = c(nr, 1))
  par(mar = c(0,0,0,0))

  # Actual plotting
  for (i in c(1:nr)){
    # Each row will be presentd as
    # team_polygon + spacing + n * (spacing + task_polygon) + notch

    team <- dat_n$team[i]
    tasks <- dat[dat$team == team, ]
    tasks <- tasks[order(tasks$task), ]

    # Create empty plot
    plot(NA, xlim = c(0, 1), ylim = c(0, 1), xlab = "", ylab = "", bty = "n", xaxt = "n", yaxt = "n")
    # Plot team polygon
    team_poly <- morph_poly(poly, team_size, 0, notch)
    polygon(team_poly, col = cols$team)
    # Add team label
    text(label_pos_x(team_poly), 0.5, labels = dat_n$team[i], cex = cex_label)

    # Calculate the size of task polygon
    tasks_n <- dat_n$n[i]
    size_x <- (1 - team_size - (tasks_n * spacing) - notch) / tasks_n

    shift <- team_size + spacing
    # plot each task polygon
    for (j in 1:nrow(tasks)){
      # Get task color
      task_col = cols[[tasks$status[j]]]
      # Prepare polygon
      task_poly <- morph_poly(poly, scale_x = size_x, shift_x = shift + spacing, notch = notch)
      polygon(task_poly, col = task_col)
      # Add task label
      text(label_pos_x(task_poly), 0.5, labels = tasks$task[j], cex = cex_label)
      # Update shift
      shift <- shift + size_x + spacing
    }
  }
  # Set initial par
  par(opar)
}
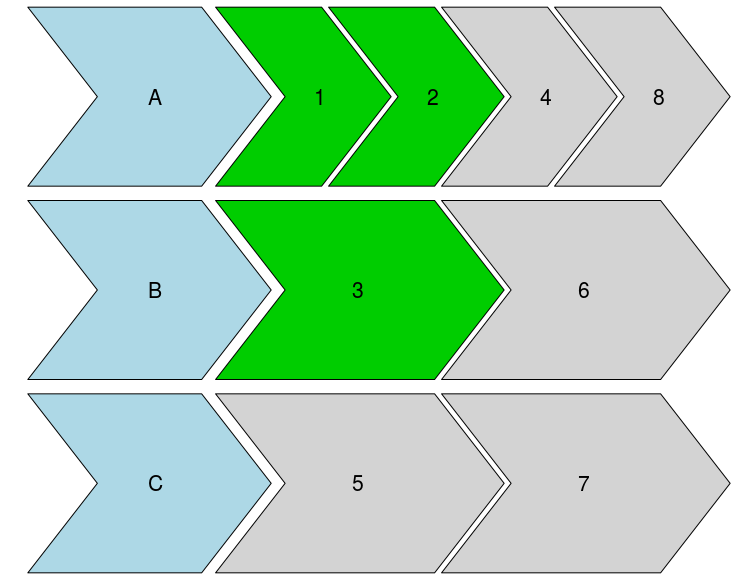
With your data set as dat it gives:
timeline_plot(dat)
![Function output]()


dput()to present your example data! – ScabbyDiagrammeRas stated. I don't think they have the shapes in the post though. – Geiger