show vertical line indicating time in grafana
Asked Answered
C

2

6

enter image description here

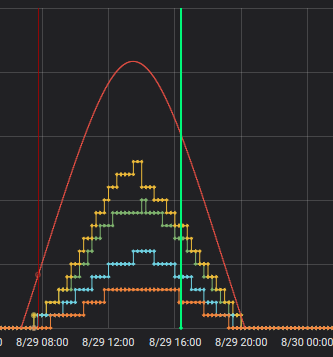
I am working on the grafana which connect the PostGreSQL database. I want to plot vertical line to x-axis which connect the point (just like x-intercept). I plot the points on graph but can't find any option/solution to plot the vertical line.

The x-axis is timestamp and y-axis is values.

I want the line similar to that picture (same as green line)

enter image description here

Caspian answered 4/3, 2020 at 14:25 Comment(0)
E
5

You could use annotations to show a vertical line with the timestamp driven by a different query. These are configured in the dashboard settings - not on the panel.

https://grafana.com/docs/grafana/latest/dashboards/build-dashboards/annotate-visualizations/

Epididymis answered 7/3, 2020 at 0:26 Comment(0)
C
1

The thing you are looking for are 'Annotation' Queries:

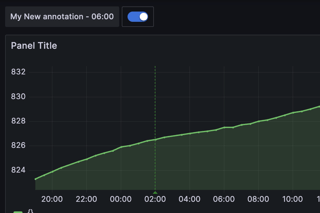
For instance, I have a graph where I want to show vertical lines at 6am every day.

You have to add an 'annotation query' on your dashboard object.

for my logs of

2023-08-31T00:00:16+0000 849
2023-08-31T06:00:16+0000 848           <---- annotation only on this one
2023-08-31T12:00:16+0000 848
2023-08-31T18:00:16+0000 848

my query would look like:

{filename="/var/log/my_logs.log"} |= `06:00`

enter image description here

(The time difference is because I am in EST, and the time is UTC)

Tutorials:

Crustaceous answered 27/8, 2023 at 22:51 Comment(0)

© 2022 - 2024 — McMap. All rights reserved.