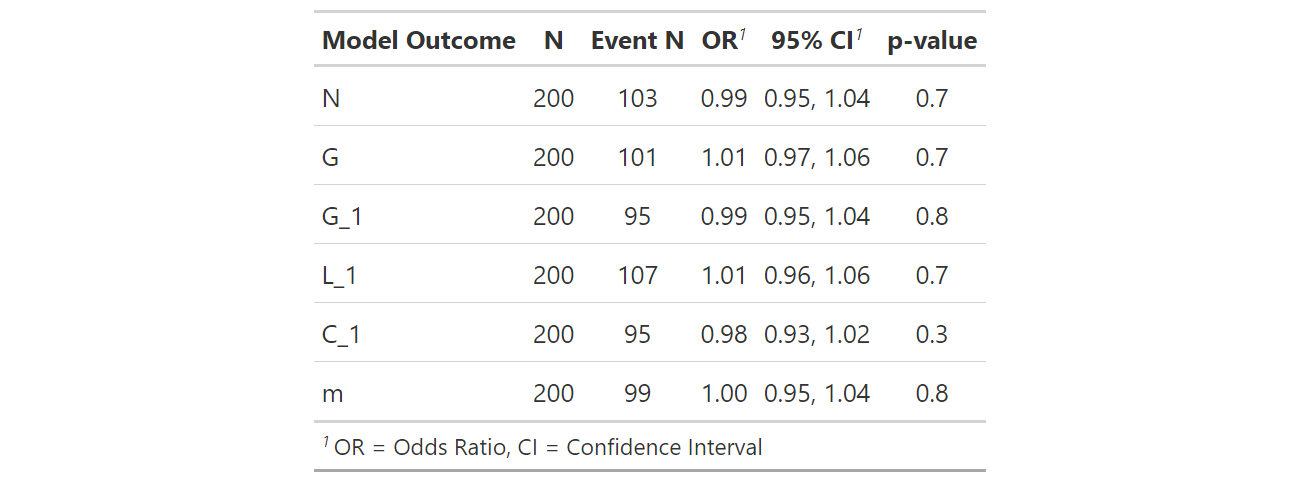
I have been using sjplot to create a combined table. This creates a HTML table. I would like to make a table that can be exported to word.
I have reviewed this post which discusses copy and pasting into word, but this alters the formatting of the columns and lines. Output several regression tables into multiple pages of a Word document in R
n1 <- glm(N  ~ Age_2 , data = n_data, family = "binomial")
g1 <- glm(G  ~ Age_2 , data = g1_data, family = "binomial")
ga1 <- glm(G_1  ~ Age_2 , data = ga1_data, family = "binomial")
l1 <- glm(L_1  ~ Age_2 , data = l1_data, family = "binomial")
c1 <- glm(C_1  ~ Age_2 , data = c1_data, family = "binomial")
m1 <- glm(m  ~ Age_2 , data = m1_data, family = "binomial")

tab_model (n1,g1,ga1,l1,c1,m1)
Also is it possible to add a line with the number that had the outcome (ie. number of N), in addition to the total number of observations per group?
Any suggestions? Willing to try other packages.


flextableoutputs to word nicely. I use a combination ofhuxtableandflextablewhen outputing to word (huxtableto build the table,flextableto output to word) – Sacerdotalismgtsummarypackage might also help here with output to work. You can change the output to knitr instead of gt to render it to word. It also has a way to compare regression models to each other: danieldsjoberg.com/gtsummary – Jueta