How to correctly use 'percentParent' in sunburst graphs with only 1 central node?
Asked Answered
G

1

6

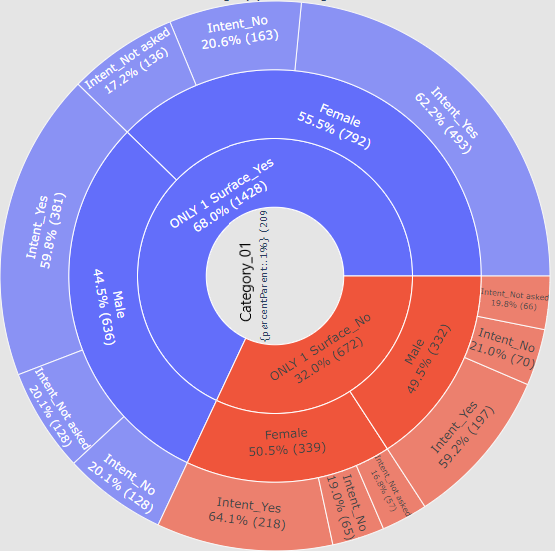
So I'm trying to build a Plotly sunburst graph that displays percentParent for each element in the graph. This works fine for all elements except for when I have only a single option for the central node/ring/whatever (see example below)

enter image description here

Since the central node obviously does not have a parent, it appears to bug out and display the bracketed call on percentParent from the texttemplate field. However, if there are 2 (or more) central nodes, it automatically calculates each's percentage of the sum total of the two.

My question is: When I have only 1 central node, how can I either hide this field for the central node only or make it correctly display "100%"?

Example code:

import pandas as pd
import plotly.graph_objects as go

df = pd.DataFrame({'node_names': ['Center', 'Yes', 'No'],
                   'node_parent': ['', 'Center', 'Center'],
                   'node_labels': ['Center', 'Center_Yes', 'Center_No'],
                   'node_counts': [1000, 701, 299]})


fig = go.Figure(
       data=go.Sunburst(
        ids=df["node_names"],
        labels=df["node_labels"], 
        parents=df["node_parent"],
        values=df["node_counts"],
        branchvalues="total",
        texttemplate = ('%{label}<br>%{percentParent:.1%}'),
    ),
)

fig.show()
Garderobe answered 20/7, 2020 at 17:9 Comment(3)
Do you mind to provide a full mcve?Heterozygote
@Heterozygote : updated post with mcve codeGarderobe
I saw your question on community.plotly too. It seems to me that here there is a possible bug or they should add a conditional template.Heterozygote
H
6

Here I found a possible way reading the help go.Sunburst.texttemplate?

import pandas as pd
import plotly.graph_objects as go

df = pd.DataFrame({'node_names': ['Center', 'Yes', 'No'],
                   'node_parent': ['', 'Center', 'Center'],
                   'node_labels': ['Center', 'Center_Yes', 'Center_No'],
                   'node_counts': [1000, 701, 299]})

fig=go.Figure(
    data=go.Sunburst(
        ids=df["node_names"],
        labels=df["node_labels"], 
        parents=df["node_parent"],
        values=df["node_counts"],
        branchvalues="total",
        texttemplate = ('%{label}',
                        '%{label}<br>%{percentParent:.1%}',
                        '%{label}<br>%{percentParent:.1%}',
                        '%{label}<br>%{percentParent:.1%}'),
    ),
)

fig.show()
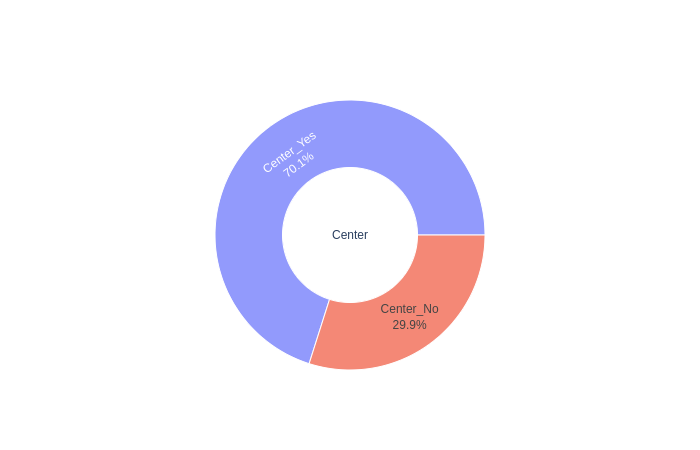
enter image description here

You could eventually modify the firs element in texttemplate as '%{label}<br>100%'.

Heterozygote answered 21/7, 2020 at 17:30 Comment(1)
Interesting, I didn't think to pass an array to texttemplate. Thanks!Garderobe

© 2022 - 2024 — McMap. All rights reserved.