How to conditionally format a cell in a [gt] table based on the value of the cell
Asked Answered
E

1

6

The gt package lets users easily format cells based on conditional statements about the rows. I'm looking for a way to format each cell based on the value in the cell.

Here's what I mean. In the table below, I'd like to color each cell with S&P values by the value it contains.

library(gt)
library(dplyr)
library(tidyr)

# some arbitrary values of the S&P 500
jan08 <- sp500 %>% 
  filter(between(date, as.Date("2008-01-01"), as.Date("2008-01-15"))) %>%
  select(date, open, high, low, close)

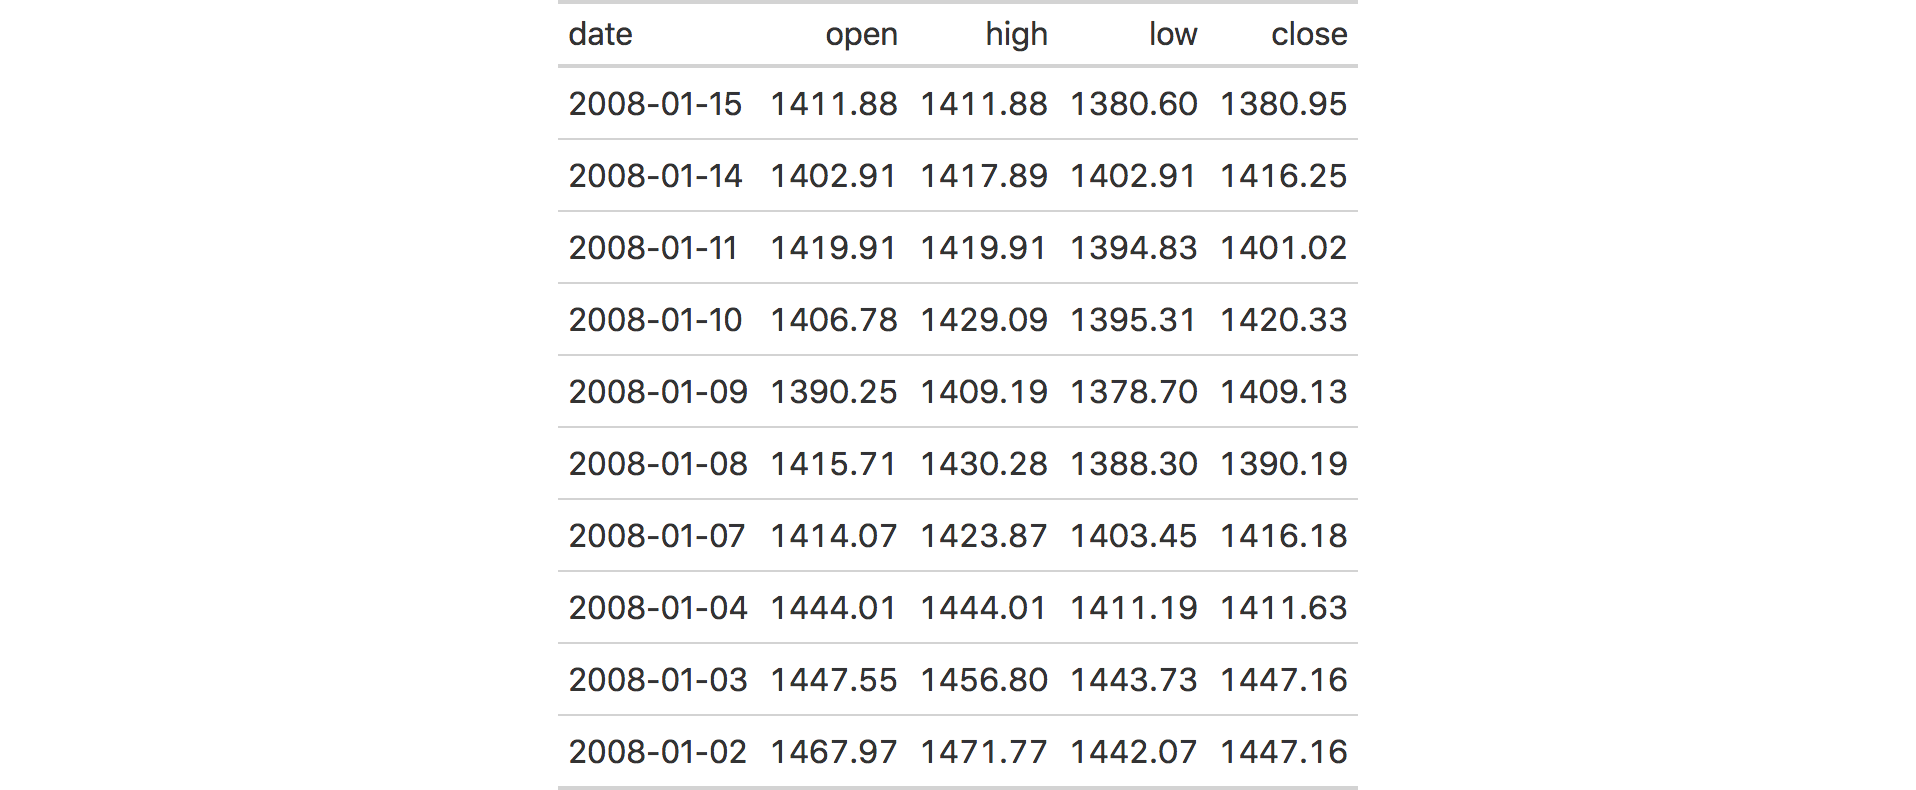
gt(jan08)

basic gt table

This function returns the appropriate color name for each value as a character string.

## this is the range of values
sp500.range <- jan08 %>% pivot_longer(cols = c(open, high, low, close))
heat_palette <- leaflet::colorNumeric(palette = "YlOrRd",
                                      domain = sp500.range$value)

# For example:
> heat_palette(1411.88)
[1] "#FEB852"

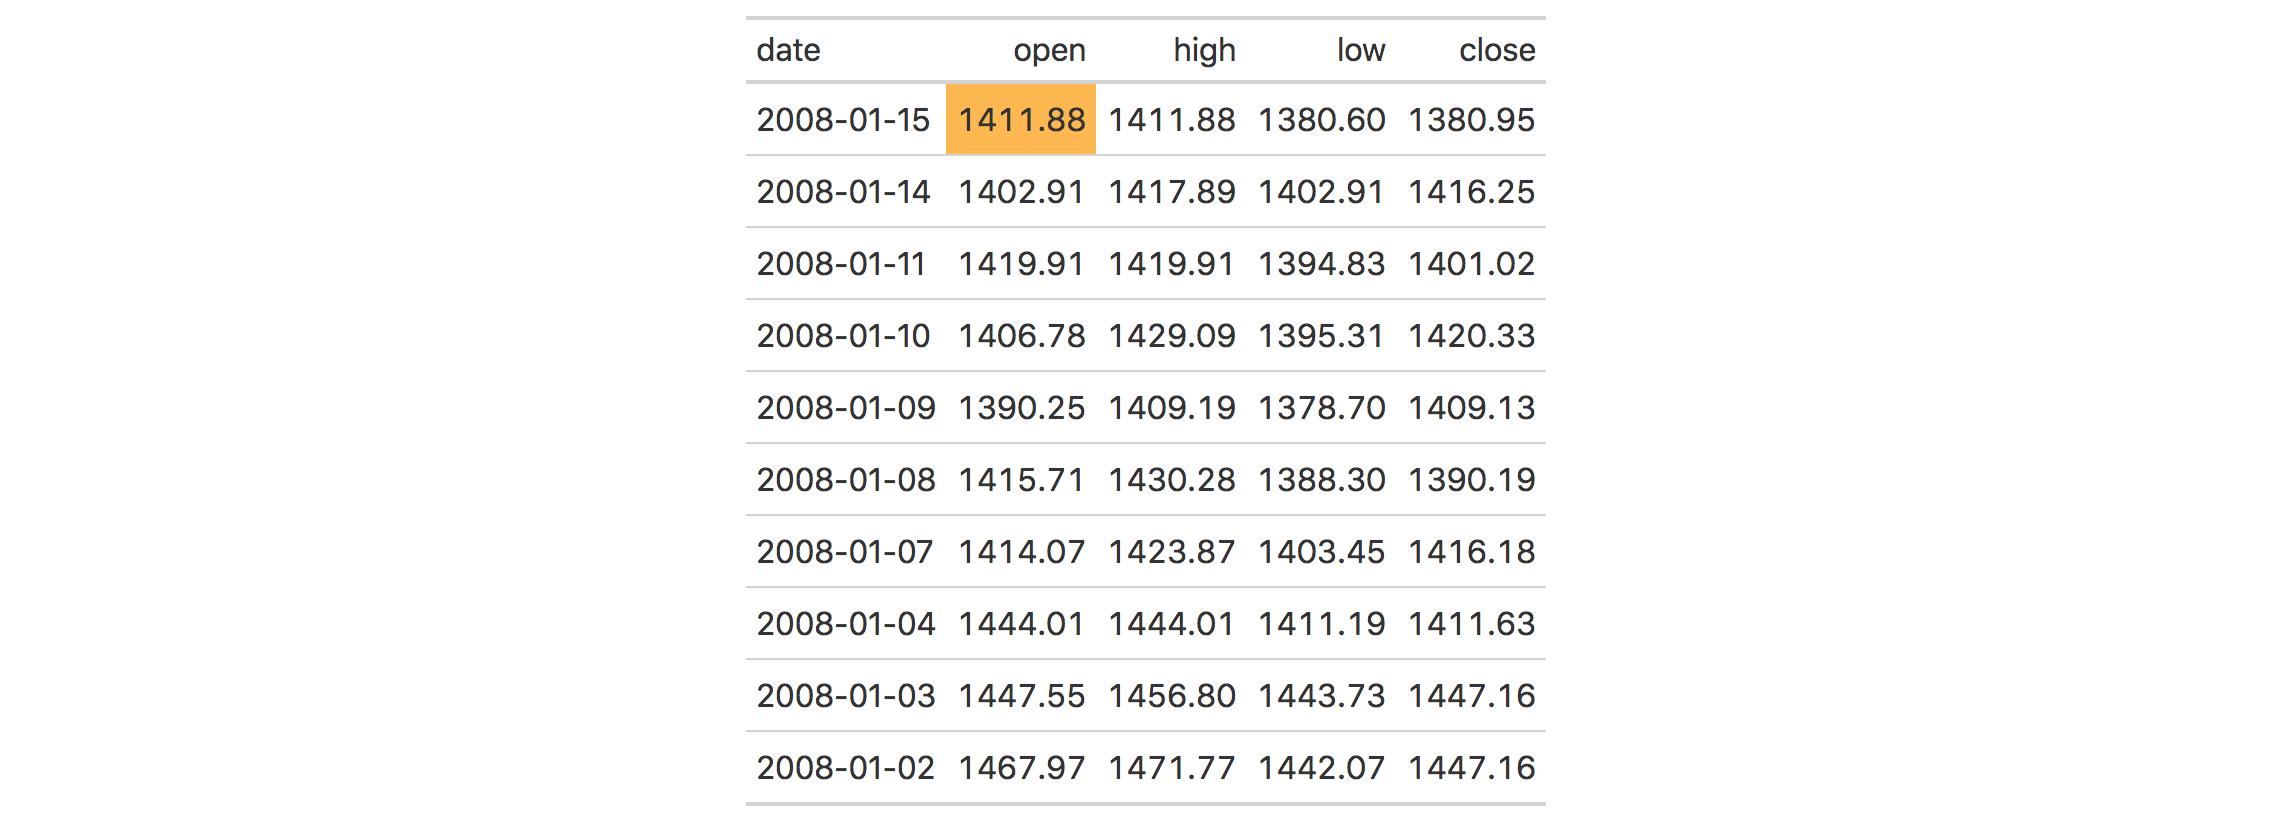
Each cell can be colored manually, but this obviously isn't practical.

gt(jan08) %>%
  tab_style(style = cell_fill(color = heat_palette(1411.88)),
            locations = cells_body(columns = "open", 
                                   rows = (open == 1411.88)))

gt with filled cell

Is there a way to use the tab_style function to conditionally fill cells based on the value of the cell?

Etesian answered 17/9, 2020 at 19:25 Comment(0)
C
6

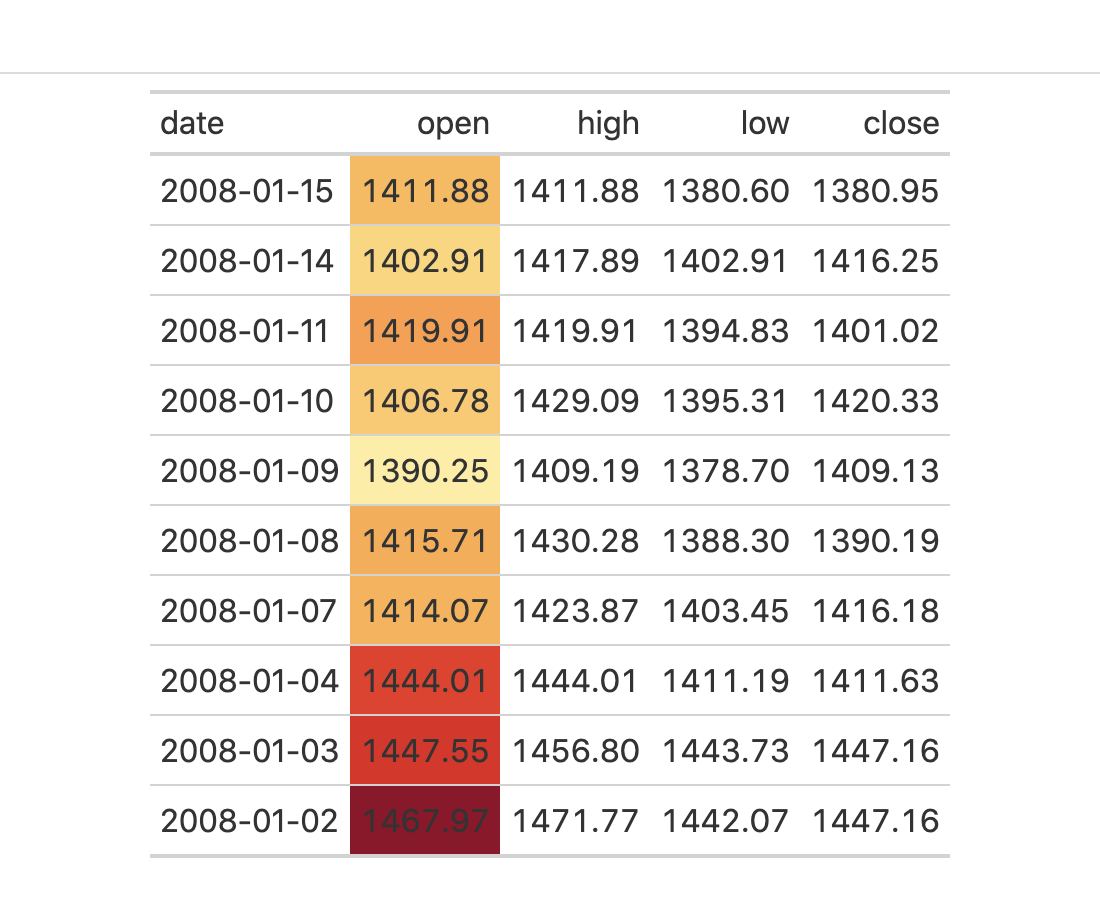
Create the gt object first and then loop over the sequence of rows in a for loop to color as the color argument in cell_fill takes a value of length 1

library(gt)
gtobj <- gt(jan08)
ht_values <- heat_palette(jan08$open)
for(i in seq_along(jan08$open)) {
   gtobj <- gtobj %>%
         tab_style(style = cell_fill(color = ht_values[i]),
                   locations = cells_body(columns = "open", rows = i))
}


gtobj

-output

enter image description here

EDIT: This for loop can then be placed in a function like this.

fill_column <- function(gtobj, column){
  ht_values <- heat_palette(jan08 %>% pull(sym(column)))
  for(i in seq_along(jan08 %>% pull(sym(column)))){
    gtobj <- gtobj %>%
      tab_style(style = cell_fill(color = ht_values[i]),
                locations = cells_body(columns = column, rows = i))
  }
  gtobj
}

Then, this function can be included with a pipe.

gt(jan08) %>%
  fill_column("open") %>%
  fill_column("high") %>%
  fill_column("low") %>%
  fill_column("close")

gt table with all columns filled

Cottier answered 17/9, 2020 at 19:46 Comment(3)
This is great, @akrun. Thank you. I took your answer and put the for loop into a function. Do you mind if I edit your answer to include this? Then I'll accept it.Etesian
One modification to the column_fill function to make it completely self-contained, reference the dataframe from the gtobj. I.e. gtobj$`_data`Freestanding
@fe108 Please check the OP's codeCottier

© 2022 - 2024 — McMap. All rights reserved.