Curve fit with parameter bounds
Asked Answered
D

2

6

I have experimental data :

xdata = [85,86,87,88,89,90,91,91.75,93,96,100,101,102,103,104,105,106,107.25,108.25,109,109.75,111,112,112.75,114,115.25,116,116.75,118,119.25,120,121,122,122.5,123.5,125.25,126,126.75,127.75,129.25,130.25,131,131.75,133,134.25,135,136,137,138,139,140,141,142,143,144,144.75,146,146.75,148,149.25,150,150.5,152,153.25,154,155,156.75,158,159,159.75,161,162,162.5,164,165,166]

ydata = [0.2,0.21,0.18,0.21,0.19,0.2,0.21,0.2,0.18,0.204,0.208,0.2,0.21,0.25,0.2,0.19,0.216,0.22,0.224,0.26,0.229,0.237,0.22,0.246,0.25,0.264,0.29,0.274,0.29,0.3,0.27,0.32,0.38,0.348,0.372,0.398,0.35,0.42,0.444,0.48,0.496,0.55,0.51,0.54,0.57,0.51,0.605,0.57,0.65,0.642,0.6,0.66,0.7,0.688,0.69,0.705,0.67,0.717,0.69,0.728,0.75,0.736,0.73,0.744,0.72,0.76,0.752,0.74,0.76,0.7546,0.77,0.74,0.758,0.74,0.78,0.76]

And the formula f(x) = m1 + m2 / (1 + e ^ (-m3*(x - m4))). I need to find m1, m2, m3, m4 with least square method, where 0.05 < m1 < 0.3 0.3 < m2 < 0.8 0.05 < m3 < 0.5 100 < m4 < 200.

I use curve_fit and my function is :

def f(xdata, m1, m2, m3, m4):
    if m1 > 0.05 and m1 < 0.3 and \
       m2 > 0.3 and m2 < 0.8 and \
       m3 > 0.05 and m3 < 0.5 and \
       m4 > 100 and m4 < 200:
          return m1 + (m2 * 1. / (1 + e ** (-m3 * (x - m4))))
    return (abs(m1) + abs(m2) + abs(m3) + abs(m4)) * 1e14 # some large number

But the program return the error: RuntimeError: Optimal parameters not found: Number of calls to function has reached maxfev = 1000.

What to do?

import numpy as np
from scipy.optimize import curve_fit
from math import e

xdata = np.array([85,86,87,88,89,90,91,91.75,93,96,100,101,102,103,104,105,106,107.25,108.25,109,109.75,111,112,112.75,114,115.25,116,116.75,118,119.25,120,121,122,122.5,123.5,125.25,126,126.75,127.75,129.25,130.25,131,131.75,133,134.25,135,136,137,138,139,140,141,142,143,144,144.75,146,146.75,148,149.25,150,150.5,152,153.25,154,155,156.75,158,159,159.75,161,162,162.5,164,165,166])`
ydata = np.array([0.2,0.21,0.18,0.21,0.19,0.2,0.21,0.2,0.18,0.204,0.208,0.2,0.21,0.25,0.2,0.19,0.216,0.22,0.224,0.26,0.229,0.237,0.22,0.246,0.25,0.264,0.29,0.274,0.29,0.3,0.27,0.32,0.38,0.348,0.372,0.398,0.35,0.42,0.444,0.48,0.496,0.55,0.51,0.54,0.57,0.51,0.605,0.57,0.65,0.642,0.6,0.66,0.7,0.688,0.69,0.705,0.67,0.717,0.69,0.728,0.75,0.736,0.73,0.744,0.72,0.76,0.752,0.74,0.76,0.7546,0.77,0.74,0.758,0.74,0.78,0.76])

def f(xdata, m1, m2, m3, m4):
    if m1 > 0.05 and m1 < 0.3 and \
       m2 > 0.3 and m2 < 0.8 and \
       m3 > 0.05 and m3 < 0.5 and \
       m4 > 100 and m4 < 200:
        return m1 + (m2 * 1. / (1 + e ** (-m3 * (x - m4))))
    return (abs(m1) + abs(m2) + abs(m3) + abs(m4)) * 1e14

print curve_fit(f, xdata, ydata)
Discourtesy answered 11/11, 2015 at 12:33 Comment(1)
Since it's not the Python code that is your problem, you'll probably get a better answer to your question at math.stackexchange.comKnotty
R
4

Set the initial parameters to useful values:

curve_fit(f, xdata, ydata, p0=(0.1, 0.5, 0.1, 150)))

Also, use xdata instead of x in your function f:

return m1 + (m2 * 1. / (1 + e ** (-m3 * (xdata - m4))))

This is my modified program:

def f(xdata, m1, m2, m3, m4):
    if (0.05 < m1 < 0.3 and
        0.3 < m2 < 0.8 and
        0.05 < m3 < 0.5 and
        100 < m4 < 200):
        return m1 + (m2 * 1. / (1 + e ** (-m3 * (xdata - m4))))
    return 1e38

print(curve_fit(f, xdata, ydata, p0=(0.1, 0.5, 0.1, 150)))

Result:

(array([   0.19567035,    0.56792559,    0.13434829,  129.98915877]), 
 array([[  2.94622909e-05,  -3.96126279e-05,   1.99236054e-05,
          7.48438125e-04],
       [ -3.96126279e-05,   9.24145662e-05,  -4.62302643e-05,
          5.04671621e-04],
       [  1.99236054e-05,  -4.62302643e-05,   3.77364832e-05,
         -2.43866126e-04],
       [  7.48438125e-04,   5.04671621e-04,  -2.43866126e-04,
          1.34700612e-01]]))
Robtrobust answered 11/11, 2015 at 13:10 Comment(1)
Thank you! x (instead of xdata) is a typo.Discourtesy
T
3

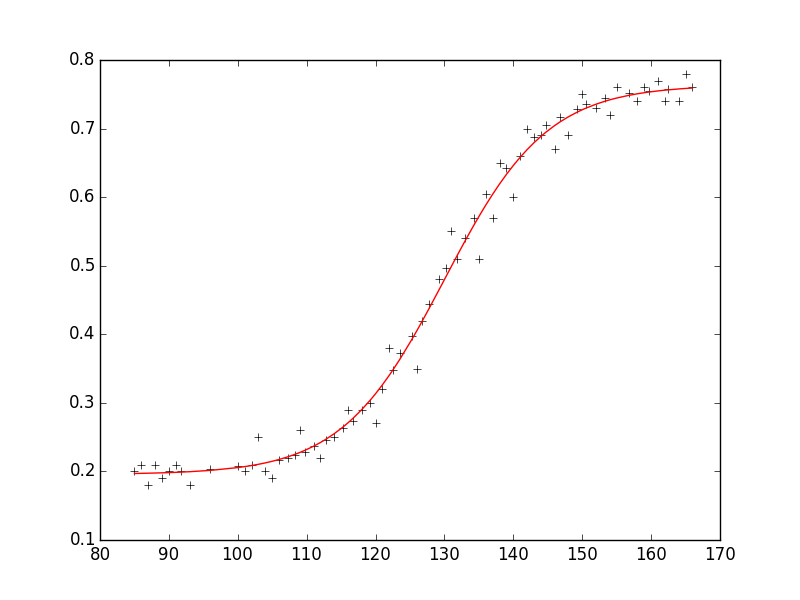
Alternatively, you can also use lmfit which allows you to set boundaries easily and avoids the "ugly" if statement in your function. The parameters you obtain are the following:

m1:   0.19567033 +/- 0.005427 (2.77%) (init= 0.1)
m2:   0.56792558 +/- 0.009613 (1.69%) (init= 0.5)
m3:   0.13434829 +/- 0.006143 (4.57%) (init= 0.2)
m4:   129.989156 +/- 0.367009 (0.28%) (init= 150)

and the output you obtain looks like this:

enter image description here

Here is the entire code with several comments; let me know if you have additional questions:

from lmfit import minimize, Parameters, Parameter, report_fit
import numpy as np

xdata = np.array([85,86,87,88,89,90,91,91.75,93,96,100,101,102,103,104,105,106,107.25,108.25,109,109.75,111,112,112.75,114,115.25,116,116.75,118,119.25,120,121,122,122.5,123.5,125.25,126,126.75,127.75,129.25,130.25,131,131.75,133,134.25,135,136,137,138,139,140,141,142,143,144,144.75,146,146.75,148,149.25,150,150.5,152,153.25,154,155,156.75,158,159,159.75,161,162,162.5,164,165,166])
ydata = np.array([0.2,0.21,0.18,0.21,0.19,0.2,0.21,0.2,0.18,0.204,0.208,0.2,0.21,0.25,0.2,0.19,0.216,0.22,0.224,0.26,0.229,0.237,0.22,0.246,0.25,0.264,0.29,0.274,0.29,0.3,0.27,0.32,0.38,0.348,0.372,0.398,0.35,0.42,0.444,0.48,0.496,0.55,0.51,0.54,0.57,0.51,0.605,0.57,0.65,0.642,0.6,0.66,0.7,0.688,0.69,0.705,0.67,0.717,0.69,0.728,0.75,0.736,0.73,0.744,0.72,0.76,0.752,0.74,0.76,0.7546,0.77,0.74,0.758,0.74,0.78,0.76])

def fit_fc(params, x, data):  
    m1 = params['m1'].value
    m2 = params['m2'].value
    m3 = params['m3'].value
    m4 = params['m4'].value

    model = m1 + (m2 * 1. / (1 + np.exp(-m3 * (x - m4))))
    return model - data #that's what you want to minimize

# create a set of Parameters
# 'value' is the initial condition
# 'min' and 'max' define your boundaries
params = Parameters()
params.add('m1', value= 0.1, min=0.05, max=0.3) 
params.add('m2', value= 0.5, min=0.3, max=0.8)
params.add('m3', value= 0.2, min=0.05, max=0.5) 
params.add('m4', value= 150.0, min=100, max=200) 

# do fit, here with leastsq model
result = minimize(fit_fc, params, args=(xdata, ydata))

# calculate final result
final = ydata + result.residual

# write error report
report_fit(params)

#plot results
try:
    import pylab
    pylab.plot(xdata, ydata, 'k+')
    pylab.plot(xdata, final, 'r')
    pylab.show()
except:
    pass
Tonetic answered 12/11, 2015 at 10:3 Comment(7)
Oh, thank you very! I've tried this method, but done it incorrectly. I've write this line result = minimize(fit_fc, params, args=(xdata, ydata)) differently.Discourtesy
Yes, I saw the lmfit tag which was then actually not part of your question :) I really like it, quite powerful and easy to use. Glad it works now!)Tonetic
Hah) Feel free to upvote the answer)) Thanks, I forgot about this function, because use stack overflow rarely.Discourtesy
I have some issues. It returns parameters' values which I typed, not fitted ones.Discourtesy
But the example on lmfit website works correctly, there are x is defined as the linspace and y is defined as the function values.Discourtesy
When I run the code, it works perfectly and I receive the output I posted above. Do you run the code exactly like it is or did you change something? If you changed something make sure a) that your initial values are within your defined range for each parameter and b) that you unpack the correct parameters (so that you do not unpack e.g. m3 two times and assign it to m3 and m4) and c) that you do not confuse x and xdata. Let me know whether you can solve the issue!Tonetic
Still don't have a solution. Copy-paste your code, but it doesn't work properly.Discourtesy

© 2022 - 2024 — McMap. All rights reserved.