Custom logarithmic axis scaling in matplotlib
Asked Answered
V

2

6

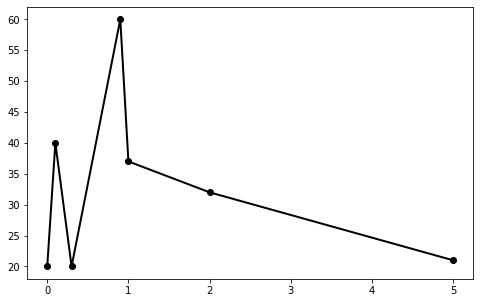
I'm trying to scale the x axis of a plot with math.log(1+x) instead of the usual 'log' scale option, and I've looked over some of the custom scaling examples but I can't get mine to work! Here's my MWE:

import matplotlib.pyplot as plt
import numpy as np
import math
from matplotlib.ticker import FormatStrFormatter
from matplotlib import scale as mscale
from matplotlib import transforms as mtransforms

class CustomScale(mscale.ScaleBase):
    name = 'custom'

    def __init__(self, axis, **kwargs):
        mscale.ScaleBase.__init__(self)
        self.thresh = None #thresh

    def get_transform(self):
        return self.CustomTransform(self.thresh)

    def set_default_locators_and_formatters(self, axis):
        pass

    class CustomTransform(mtransforms.Transform):
        input_dims = 1
        output_dims = 1
        is_separable = True

        def __init__(self, thresh):
            mtransforms.Transform.__init__(self)
            self.thresh = thresh

        def transform_non_affine(self, a):
            return math.log(1+a)

        def inverted(self):
            return CustomScale.InvertedCustomTransform(self.thresh)

    class InvertedCustomTransform(mtransforms.Transform):
        input_dims = 1
        output_dims = 1
        is_separable = True

        def __init__(self, thresh):
            mtransforms.Transform.__init__(self)
            self.thresh = thresh

        def transform_non_affine(self, a):
            return math.log(1+a)

        def inverted(self):
            return CustomScale.CustomTransform(self.thresh)

# Now that the Scale class has been defined, it must be registered so
# that ``matplotlib`` can find it.
mscale.register_scale(CustomScale)

z = [0,0.1,0.3,0.9,1,2,5]
thick = [20,40,20,60,37,32,21]

fig = plt.figure(figsize=(8,5))
ax1 = fig.add_subplot(111)
ax1.plot(z, thick, marker='o', linewidth=2, c='k')

plt.xlabel(r'$\rm{redshift}$', size=16)
plt.ylabel(r'$\rm{thickness\ (kpc)}$', size=16)
plt.gca().set_xscale('custom')
plt.show()
Verism answered 18/4, 2017 at 4:10 Comment(3)
note that the usual log scale in matplotlib uses the logarithm of base 10. math.log() defines the natural logarithm (of base e). You may want to make it clearer, which logarithm you want to use.Tavis
Oops, you're right. I meant math.log10!Verism
It seems you don't use thresh at all? Could this be dropped from your MWE without impact?Lalia
T
6

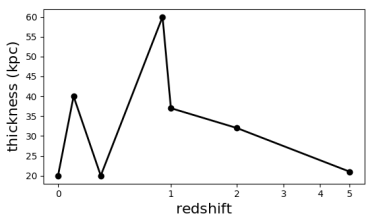
The scale consists of two Transform classes, each of which needs to provide a transform_non_affine method. One class needs to transform from data to display coordinates, which would be log(a+1), the other is the inverse and needs to transform from display to data coordinates, which would in this case be exp(a)-1.

Those methods need to handle numpy arrays, so they should use the respective numpy functions instead of those from the math package.

class CustomTransform(mtransforms.Transform):
    ....

    def transform_non_affine(self, a):
        return np.log(1+a)

class InvertedCustomTransform(mtransforms.Transform):
    ....

    def transform_non_affine(self, a):
        return np.exp(a)-1

enter image description here

Tavis answered 18/4, 2017 at 7:51 Comment(0)
F
1

There's no need to define classes yourself even the answer from @ImportanceOfBeingErnest does work.

You can use either FunctionScale or FunctionScaleLog to do this in one line. Take the FunctionScaleLog as example:

plt.gca().set_xscale("functionlog", functions=[lambda x: x + 1, lambda x: x - 1])

And with your full code:

import matplotlib.pyplot as plt
import numpy as np

z = [0, 0.1, 0.3, 0.9, 1, 2, 5]
thick = [20, 40, 20, 60, 37, 32, 21]

fig = plt.figure(figsize=(8, 5))
ax1 = fig.add_subplot(111)
ax1.plot(z, thick, marker="o", linewidth=2, c="k")

plt.xlabel(r"$\rm{redshift}$", size=16)
plt.ylabel(r"$\rm{thickness\ (kpc)}$", size=16)

# Below is my code
plt.gca().set_xscale("functionlog", functions=[lambda x: x + 1, lambda x: x - 1])
plt.gca().set_xticks(np.arange(0, 6))
plt.gca().set_xticklabels(np.arange(0, 6))

And the result is:

enter image description here

Fitzsimmons answered 1/10, 2021 at 14:36 Comment(0)

© 2022 - 2024 — McMap. All rights reserved.