How to add a colorbar to the side of a kde jointplot
Asked Answered
C

1

6

I'm trying to plot a colorbar next to my density plot with marginal axes. It does plot the colorbar, but unfortunately not on the side. That's what a tried so far:

sns.jointplot(x,y, data=df3, kind="kde", color="skyblue", legend=True, cbar=True,
              xlim=[-10,40], ylim=[900,1040])

It looks like this:

seaborn jointplot "kde"-style with colorbar

I also tried this:

from matplotlib import pyplot as plt
import seaborn as sns
import numpy as np

kdeplot = sns.jointplot(x=tumg, y=pumg, kind="kde")
plt.subplots_adjust(left=0.2, right=0.8, top=0.8, bottom=0.2)
cbar_ax = kdeplot.fig.add_axes([.85, .25, .05, .4])
plt.colorbar(cax=cbar_ax)
plt.show()

But with the second option I'm getting a runtime error:

No mappable was found to use for colorbar creation. First define a mappable such as an image (with imshow) or a contour set (with contourf).

Does anyone have an idea how to solve the problem?

Conias answered 25/3, 2020 at 9:9 Comment(0)
L
7

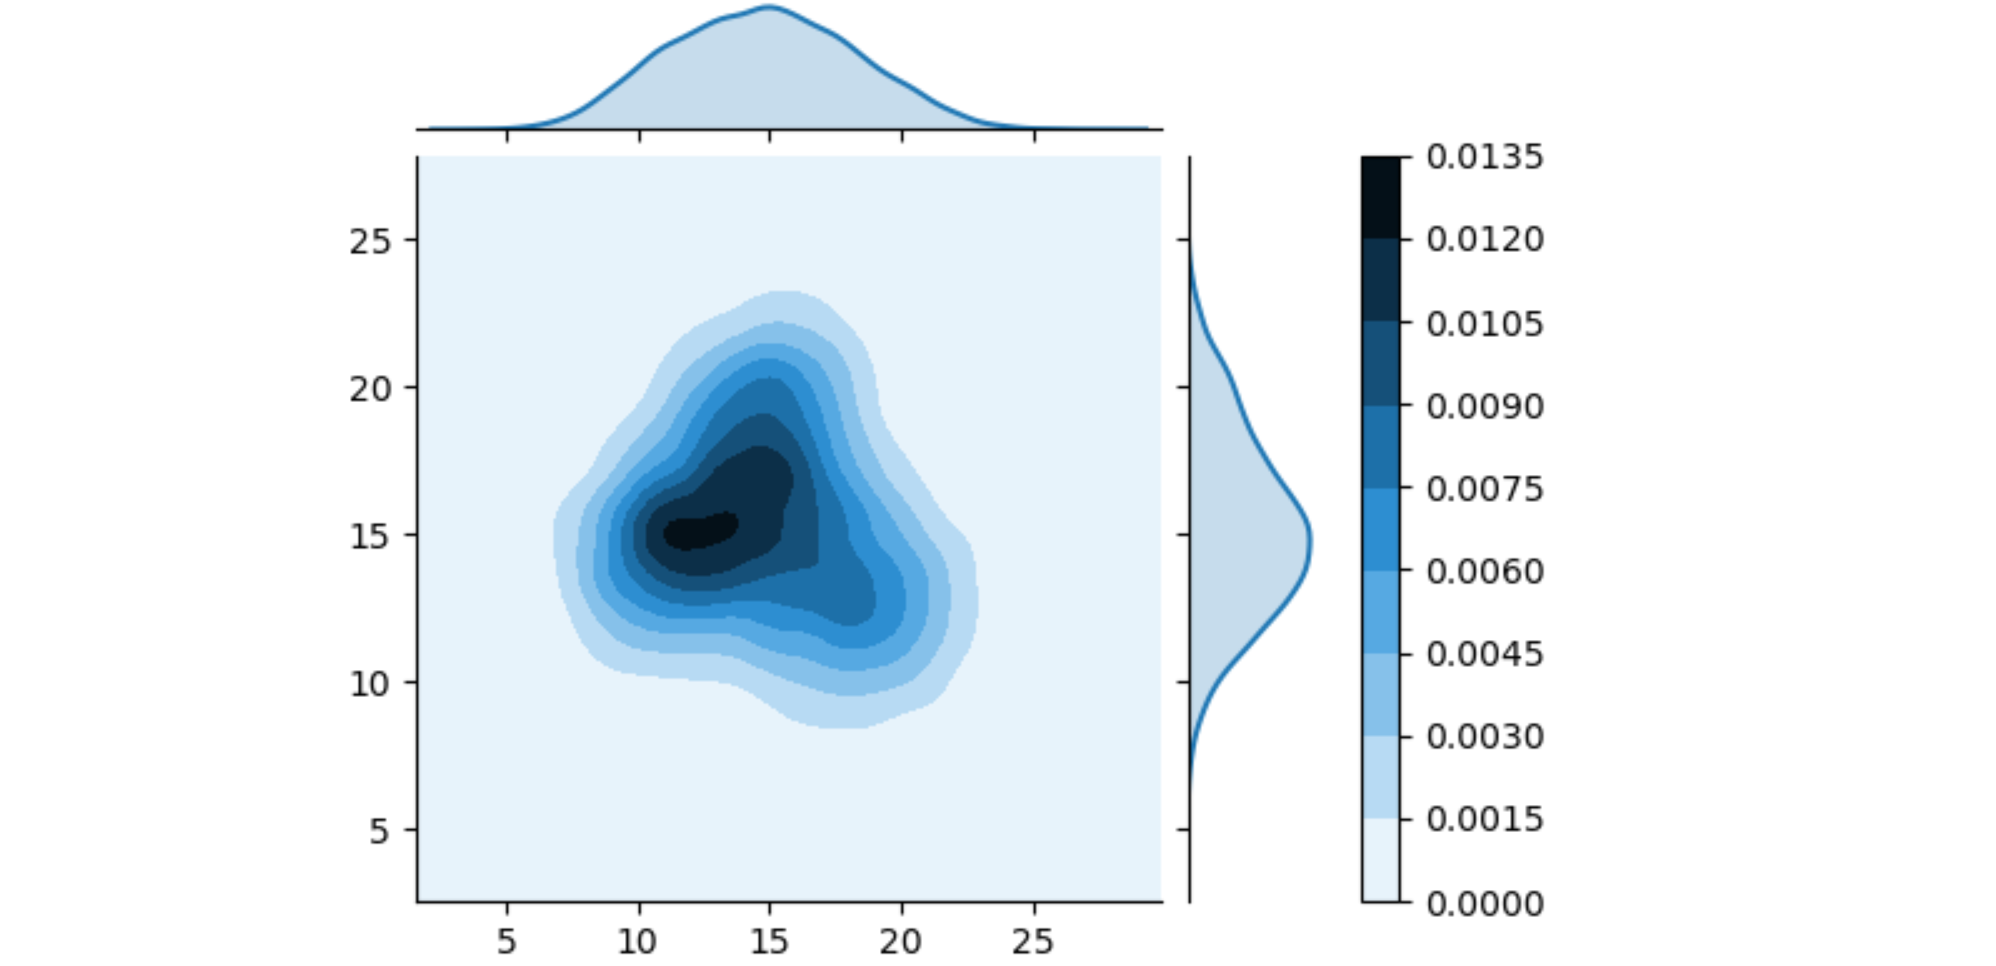
There only seems to be information for a colorbar when effectively creating the colorbar. So, an idea is to combine both approaches: add a colorbar via kdeplot, and then move it to the desired location. This will leave the main joint plot with insufficient width, so its width also should be adapted:

from matplotlib import pyplot as plt
import seaborn as sns
import numpy as np

# create some dummy data: gaussian multivariate with 10 centers with each 1000 points
tumg = np.random.normal(np.tile(np.random.uniform(10, 20, 10), 1000), 2)
pumg = np.random.normal(np.tile(np.random.uniform(10, 20, 10), 1000), 2)

kdeplot = sns.jointplot(x=tumg, y=pumg, kind="kde", cbar=True)
plt.subplots_adjust(left=0.1, right=0.8, top=0.9, bottom=0.1)
# get the current positions of the joint ax and the ax for the marginal x
pos_joint_ax = kdeplot.ax_joint.get_position()
pos_marg_x_ax = kdeplot.ax_marg_x.get_position()
# reposition the joint ax so it has the same width as the marginal x ax
kdeplot.ax_joint.set_position([pos_joint_ax.x0, pos_joint_ax.y0, pos_marg_x_ax.width, pos_joint_ax.height])
# reposition the colorbar using new x positions and y positions of the joint ax
kdeplot.fig.axes[-1].set_position([.83, pos_joint_ax.y0, .07, pos_joint_ax.height])
plt.show()

resulting plot

Lineman answered 25/3, 2020 at 12:39 Comment(0)

© 2022 - 2024 — McMap. All rights reserved.