Seaborn FacetGrid, how to show y tick labels in all subplots [duplicate]
Asked Answered
B

2

6

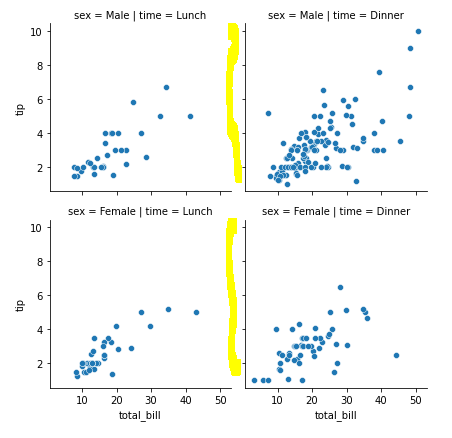
In a Seaborn FacetGrid, how can I get the y-axis tick labels to show up in all the subplots, regardless of whether or not sharey=True?

tips = sns.load_dataset("tips")
g = sns.FacetGrid(tips, col="time",  row="sex")
g.map(sns.scatterplot, "total_bill", "tip")

enter image description here

The following attempt returns the error AttributeError: 'FacetGrid' object has no attribute 'flatten'

for axis in g.flatten():
    for tick in axis.get_yticklabels():
        tick.set_visible(True)
Bosh answered 4/5, 2021 at 18:18 Comment(0)
R
6
for axis in g.axes.flat:
    axis.tick_params(labelleft=True)

This here worked for me.

Rhiamon answered 4/5, 2021 at 19:41 Comment(2)
It's essentially the same question as: #52182822Rhiamon
After searching for 1 hour...this answer finally worked. Thank you.Embroil
E
1
for axis in axes.flatten():
    for tick in axis.get_yticklabels():
        tick.set_visible(True)
Try looping through each axis of each plot and manually forcing the tick labels to be visible.

Evenson answered 4/5, 2021 at 18:44 Comment(0)

© 2022 - 2024 — McMap. All rights reserved.