We run a complex clustered application with Java 11.0.11 and -XX:ReservedCodeCacheSize=375m with the same load profile attached 24/7 without any restarts.
After we updated AdoptOpenJDK jdk-11.0.11+9 to Temurin jdk-11.0.13+8, both using -XX:ReservedCodeCacheSize=375m with no code changes in our app, just updating Java, we noticed the following changes:
- process CPU usage increased from ~ 30% to ~ 35% running on a AWS r5.8xlarge with 32 vCPUs, 256GB RAM and -Xms160G -Xmx160G, probably caused by high JVM Sweeper thread activity (see below)
- JVM CodeHeap 'non-profiled nmethods' (C2 optimized code) was filled up (used=176 MB, max=184 MB) as with Java 11.0.11 which is expected BUT
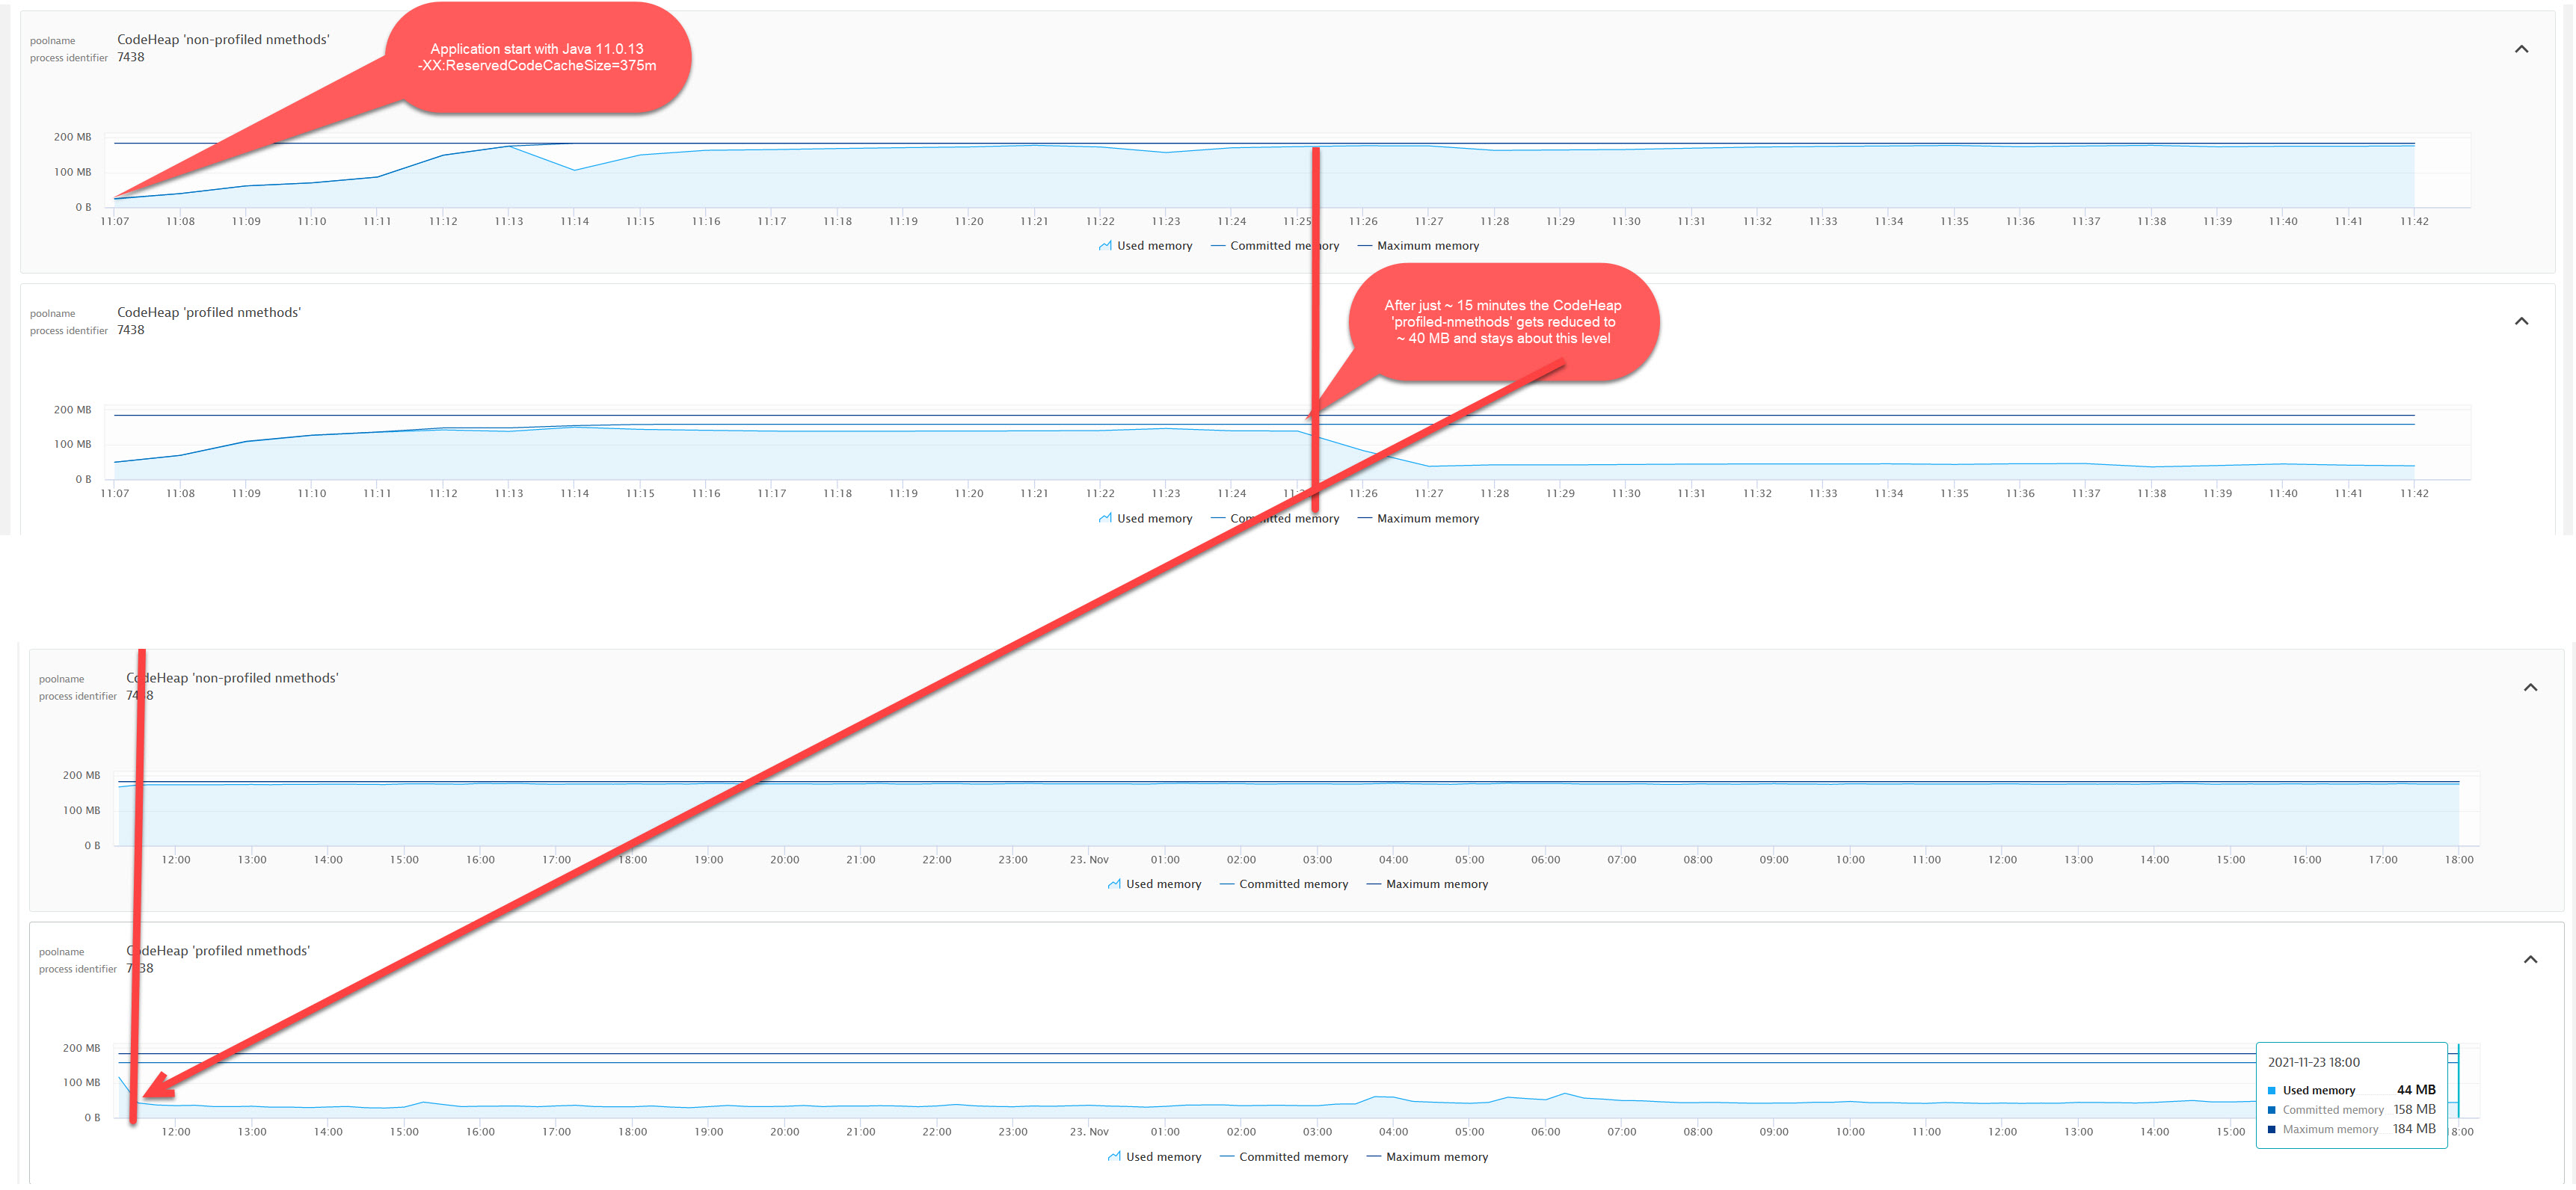
- JVM CodeHeap 'profiled nmethods' (C1 optimized code) was filled up (146 MB Used memory, 184 MB Maximum memory) shortly after process restart AND got cut down to ~ 40 MB after just 15 minutes and has stayed at this level since then (24 hours)
Java 11.0.13 + -XX:ReservedCodeCacheSize=375m, timezone=UTC+1

vs
Java 11.0.11 + -XX:ReservedCodeCacheSize=375m, timezone=UTC+1

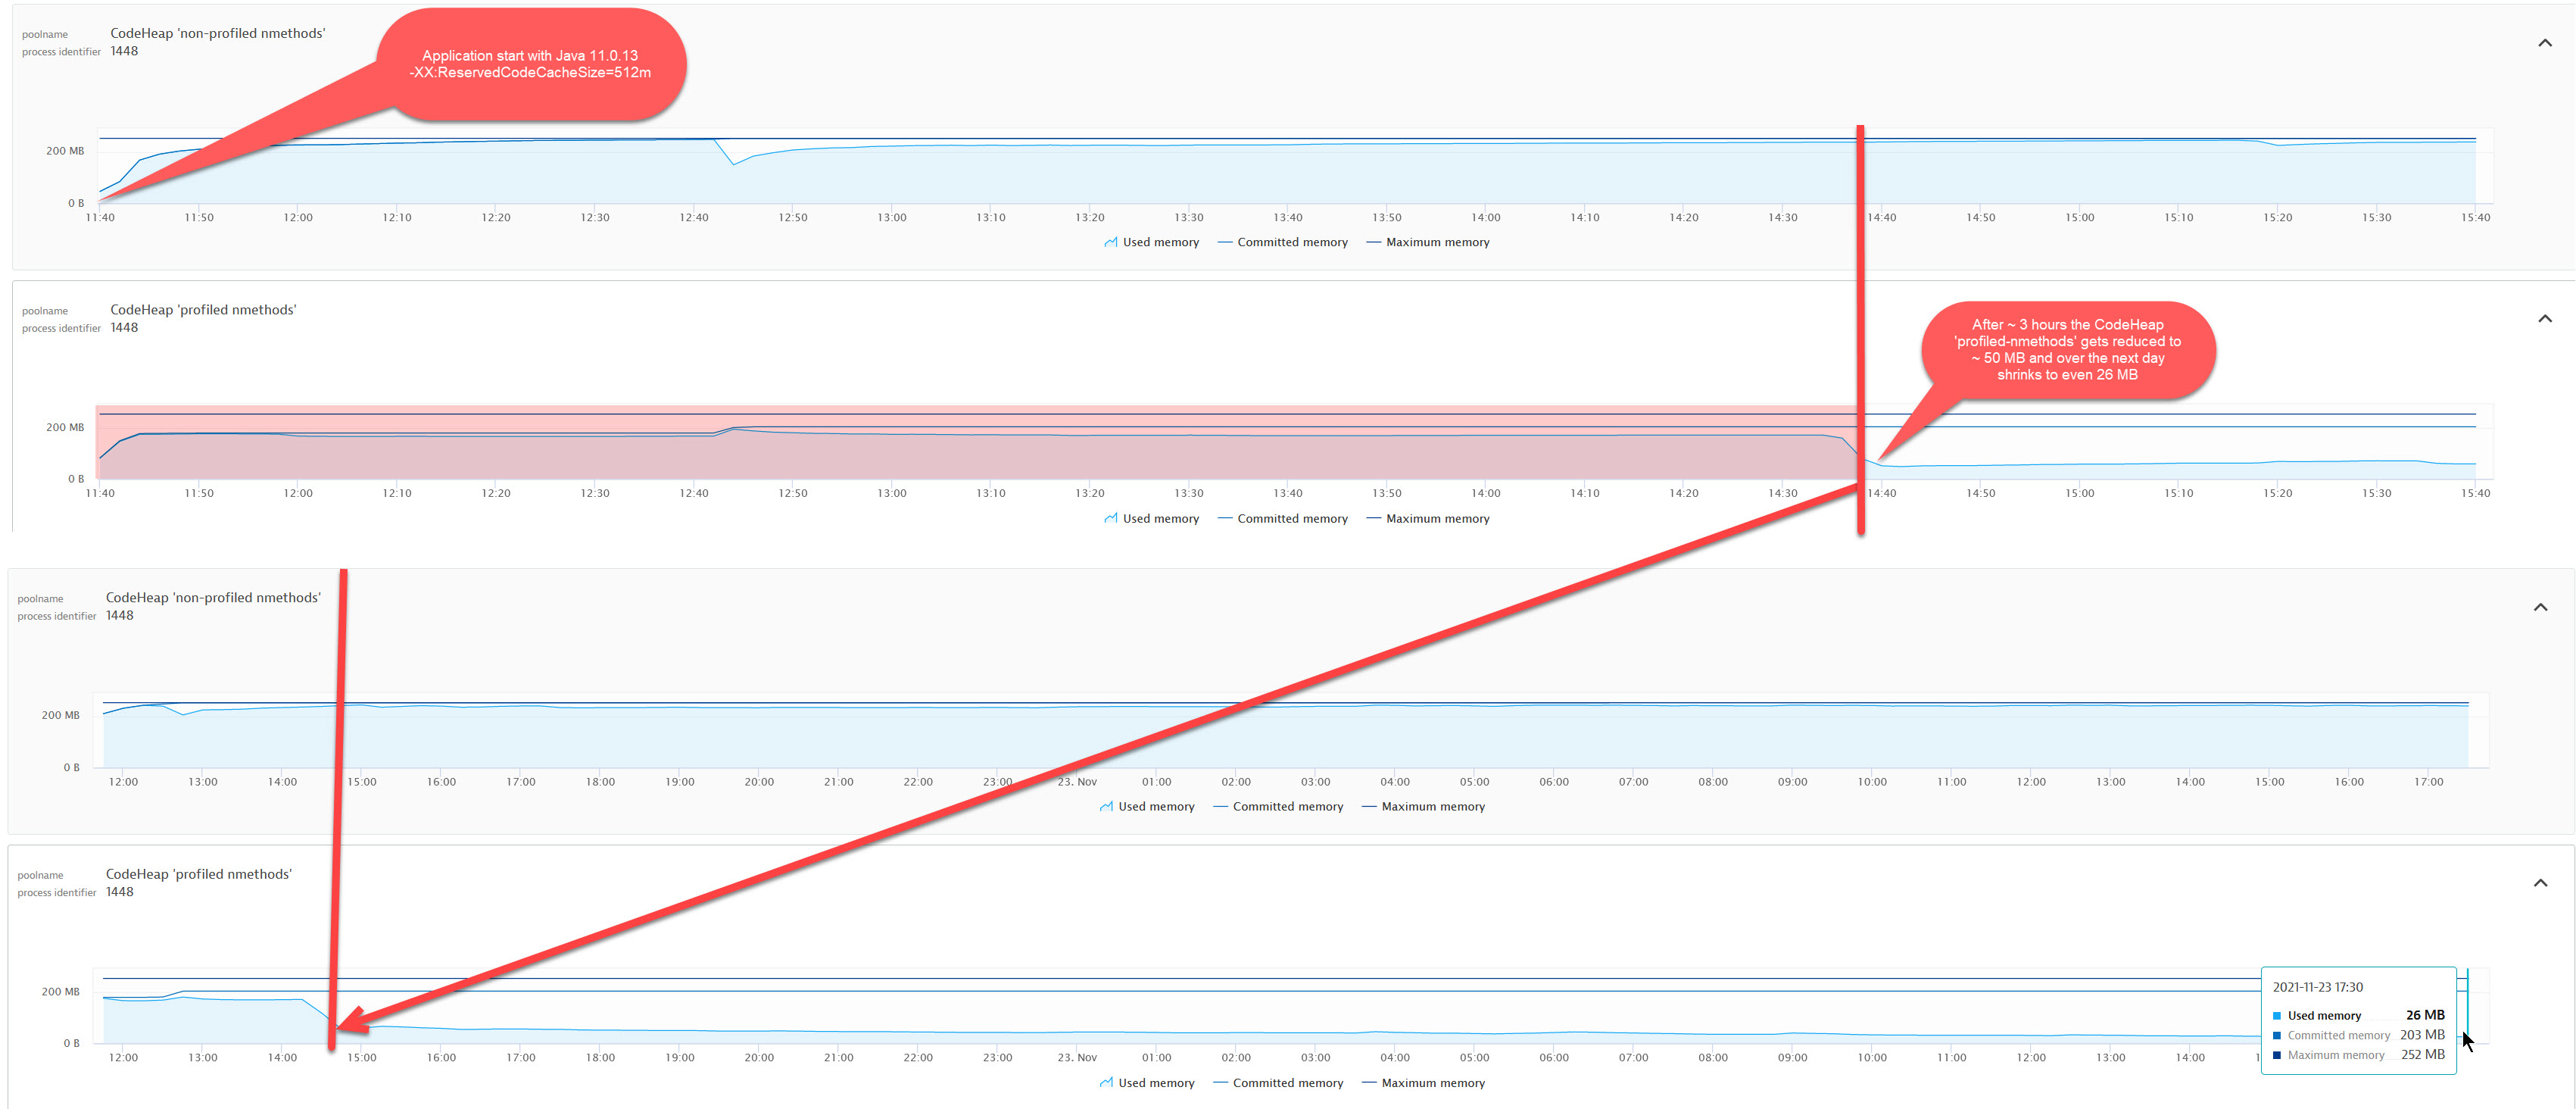
The next step was to increase the -XX:ReservedCodeCacheSize to 512m but after ~ 3 hours the JVM CodeHeap 'profiled nmethods' (C1 optimized code) got cut down again to ~ 50 MB and even decreased further over time
Java 11.0.13 + -XX:ReservedCodeCacheSize=512m, timezone=UTC+1

Therefore we decided to double -XX:ReservedCodeCacheSize to 1024m and for the last 7 days both CodeHeap areas have been stable
- CodeHeap 'non-profiled nmethods': 405 MB Used memory, 405 MB Committed memory, 508 MB Maximum memory
- CodeHeap 'profiled nmethods': 258 MB Used memory, 258 MB Committed memory, 508 MB Maximum memory
Java 11.0.13 + -XX:ReservedCodeCacheSize=1024m is running stable for one week, timezone=UTC+1

We tried these changes on different nodes and also on one node and the result is always reproducible.
With -XX:ReservedCodeCacheSize=375m the Linux perf tool shows high CPU usage for the Sweeper thread, which completely disappears with 1024m.
perf record -F 99 --output=perf-375m-uptime-21hours.data -ag -p <PID> sleep 60

+    4.82%     0.00%  Sweeper thread   libpthread-2.17.so                                                  [.] start_thread
+    4.82%     0.00%  Sweeper thread   libjvm.so                                                           [.] thread_native_entry
+    4.82%     0.00%  Sweeper thread   libjvm.so                                                           [.] Thread::call_run
+    4.82%     0.00%  Sweeper thread   libjvm.so                                                           [.] JavaThread::thread_main_inner
+    4.82%     0.00%  Sweeper thread   libjvm.so                                                           [.] NMethodSweeper::sweeper_loop
+    4.82%     0.00%  Sweeper thread   libjvm.so                                                           [.] NMethodSweeper::possibly_sweep
+    4.79%     0.03%  Sweeper thread   libjvm.so                                                           [.] NMethodSweeper::sweep_code_cache
+    4.24%     0.03%  Sweeper thread   libjvm.so                                                           [.] NMethodSweeper::process_compiled_method
+    4.05%     0.00%  C2 CompilerThre  libpthread-2.17.so                                                  [.] start_thread
+    4.05%     0.00%  C2 CompilerThre  libjvm.so                                                           [.] thread_native_entry
+    4.05%     0.00%  C2 CompilerThre  libjvm.so                                                           [.] Thread::call_run
+    4.05%     0.00%  C2 CompilerThre  libjvm.so                                                           [.] JavaThread::thread_main_inner
+    4.05%     0.00%  C2 CompilerThre  libjvm.so                                                           [.] CompileBroker::compiler_thread_loop
+    4.04%     0.00%  C2 CompilerThre  libjvm.so                                                           [.] CompileBroker::invoke_compiler_on_method
+    4.03%     0.00%  C2 CompilerThre  libjvm.so                                                           [.] C2Compiler::compile_method
+    4.03%     0.00%  C2 CompilerThre  libjvm.so                                                           [.] Compile::Compile
+    3.53%     0.68%  Sweeper thread   libjvm.so                                                           [.] CompiledMethod::cleanup_inline_caches_impl
As a result the CPU usage with Java 11.0.13 and -XX:ReservedCodeCacheSize=1024m is the same or slightly better than with Java 11.0.11 and -XX:ReservedCodeCacheSize=375m
During our investigation no helpful log lines were printed, e.g. we expected to see something like "CodeCache is full. Compiler has been disabled."
jcmd <PID> VM.log what=codecache=info,sweep*=trace decorators=time,uptime,level,tags output=codecache-sweep.log
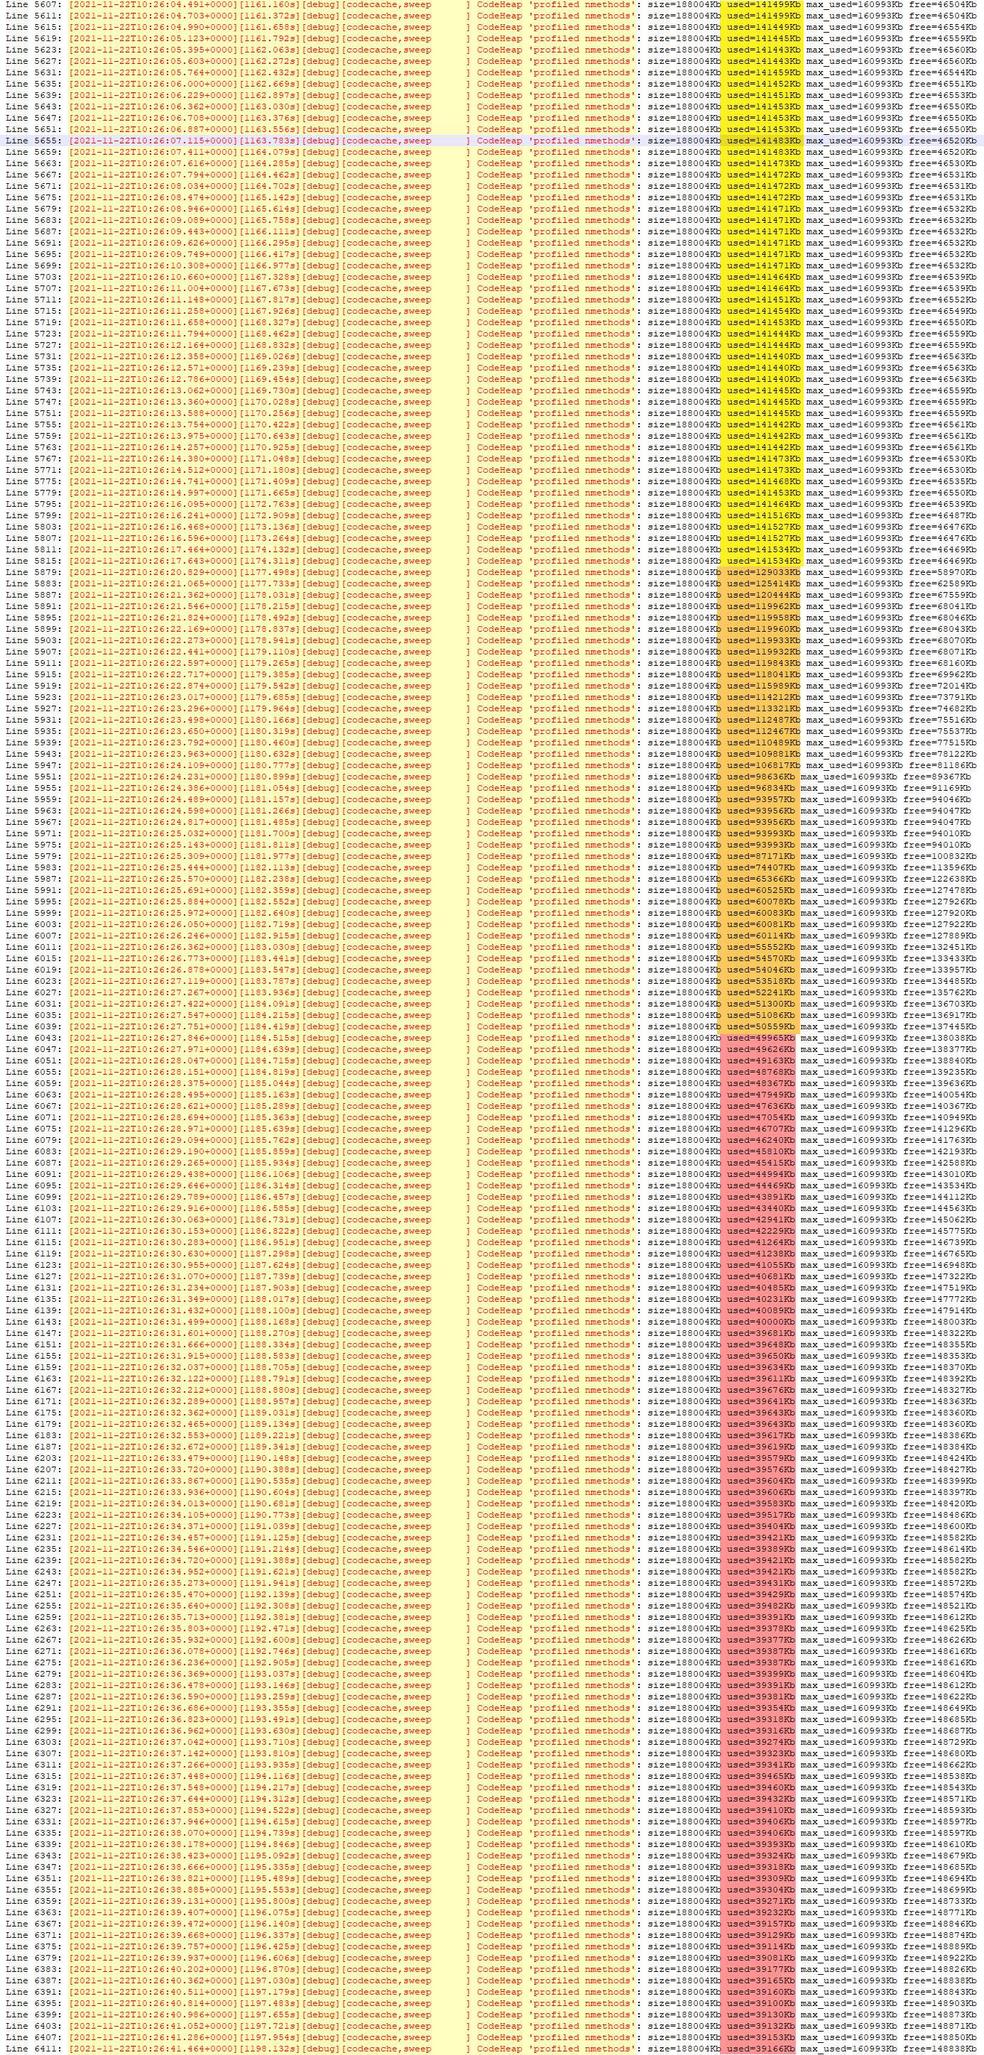
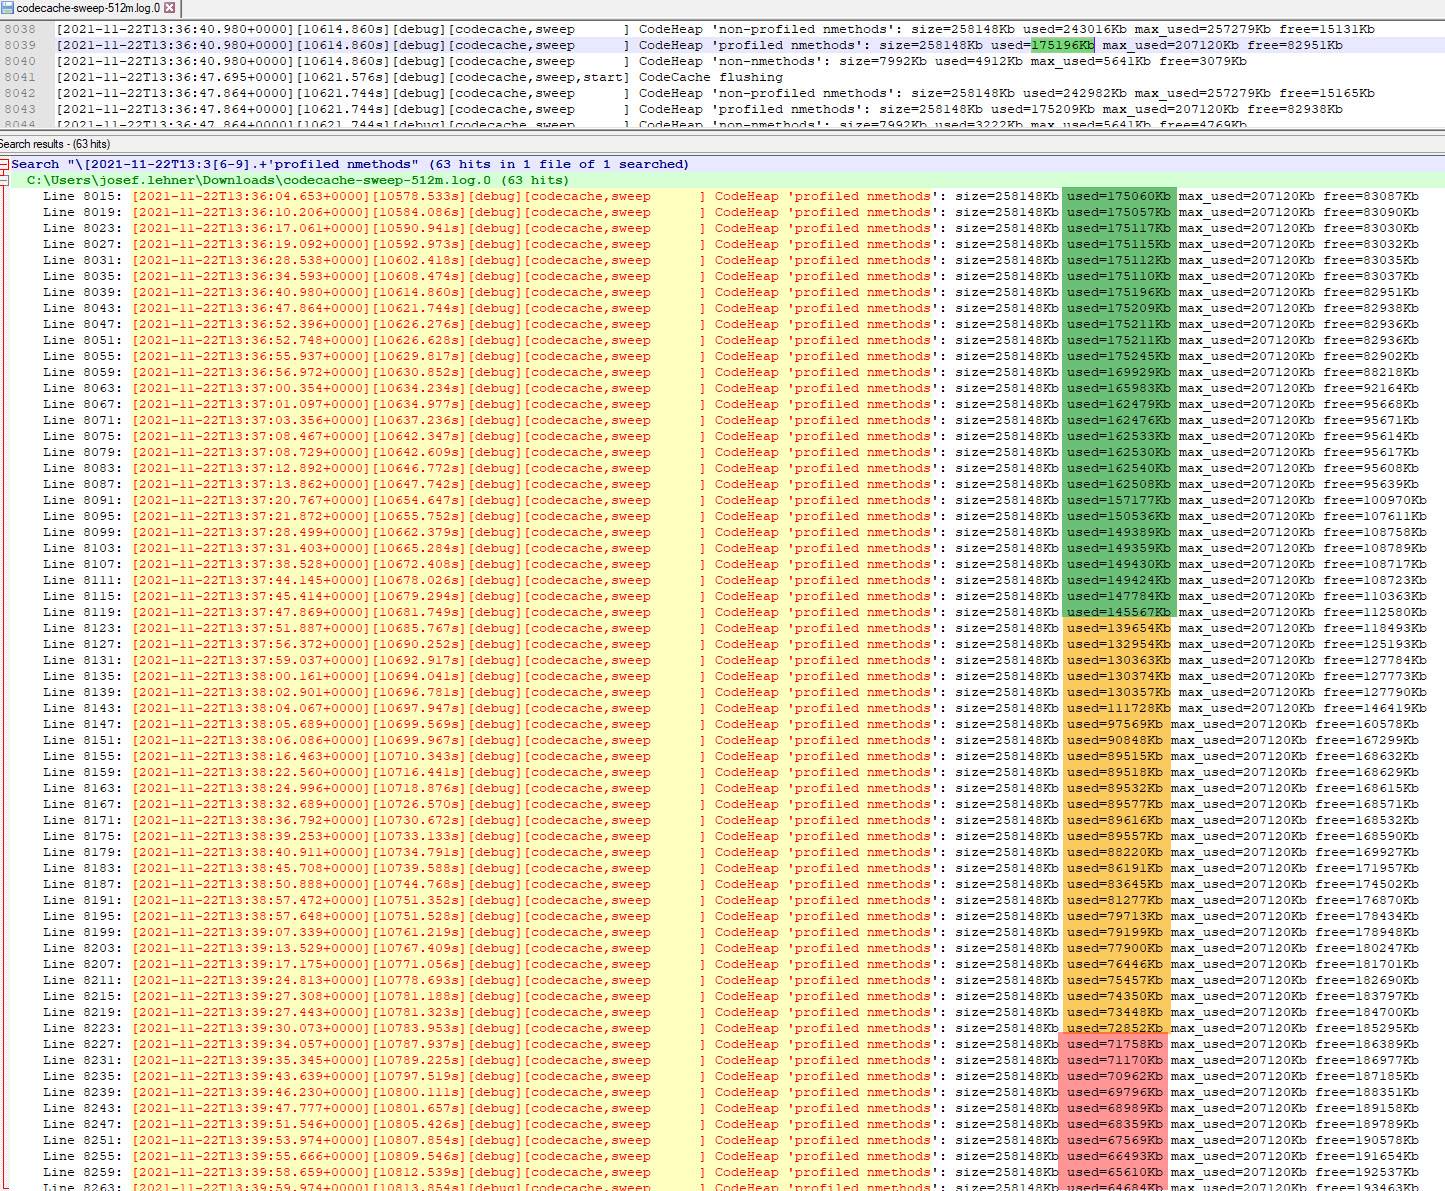
All charts in the picture use timezone UTC+1. All timestamps in the log files are UTC+0.
The colors are just intended to show changes over time.
codecache-sweep-375m.log.0
Regex for interesting start time: \[2021-11-22T10:2[5-9].+'profiled nmethods' - A lot of sweeps per minute

codecache-sweep-512m.log.0
Regex for interesting start time: \[2021-11-22T13:3[6-9].+'profiled nmethods - Still many sweeps per minute.

codecache-sweep-1024m.log
All fine, nothing special, avg 5 sweeps per day

Please be aware that a lot of changes in the code cache / code heap components were made in Java 11.0.12 (release notes): Search for CodeHeap
- JDK-8223444 Improve CodeHeap Free Space Management
- JDK-8231460 Performance issue (CodeHeap) with large free blocks
- ...
Can you please help us to understand the reasoning and implications of CodeHeap 'profiled nmethods' shrinking down to a very low level and not increasing anymore?
UPDATE 2021-12-28
Re-running 11.0.11 and 11.0.13 with -XX:ReservedCodeCacheSize=375m and jcmd <pid> Compiler.CodeHeap_Analytics aggregate every 5 seconds to collect more data for the OpenJDK team.
zip with log and CodeHeap_Analytics data
The much higher code sweeper invocations (with 11.0.13) can still be reproduced.
Java 11.0.11 2h uptime, sweeper invocations:
grep -F '[codecache,sweep,start]' codecache-sweep-11.0.11_375m.log* | wc -l
14.458

Java 11.0.13 2h uptime, sweeper invocations:
grep -F '[codecache,sweep,start]' codecache-sweep-11.0.13_375m.log* | wc -l
41.901
For detailed statistics please open the jcmd_compiler_codeheap_analytics_aggregate files from the zip.


