TL;DR
The start time (or initiation time) of a request corresponds, not to the moment the browser actually sends the request, but to the moment the browser initiates the request.
An explanation
According to Chrome's documentation,
By default, the requests in the Requests table are sorted by initiation time [and in ascending order].
But initiation time does not correspond to the moment when the browser actually sends the request! From the browser's point of view, the actual request is initiated/started (if not sent) before the associated preflight request is.
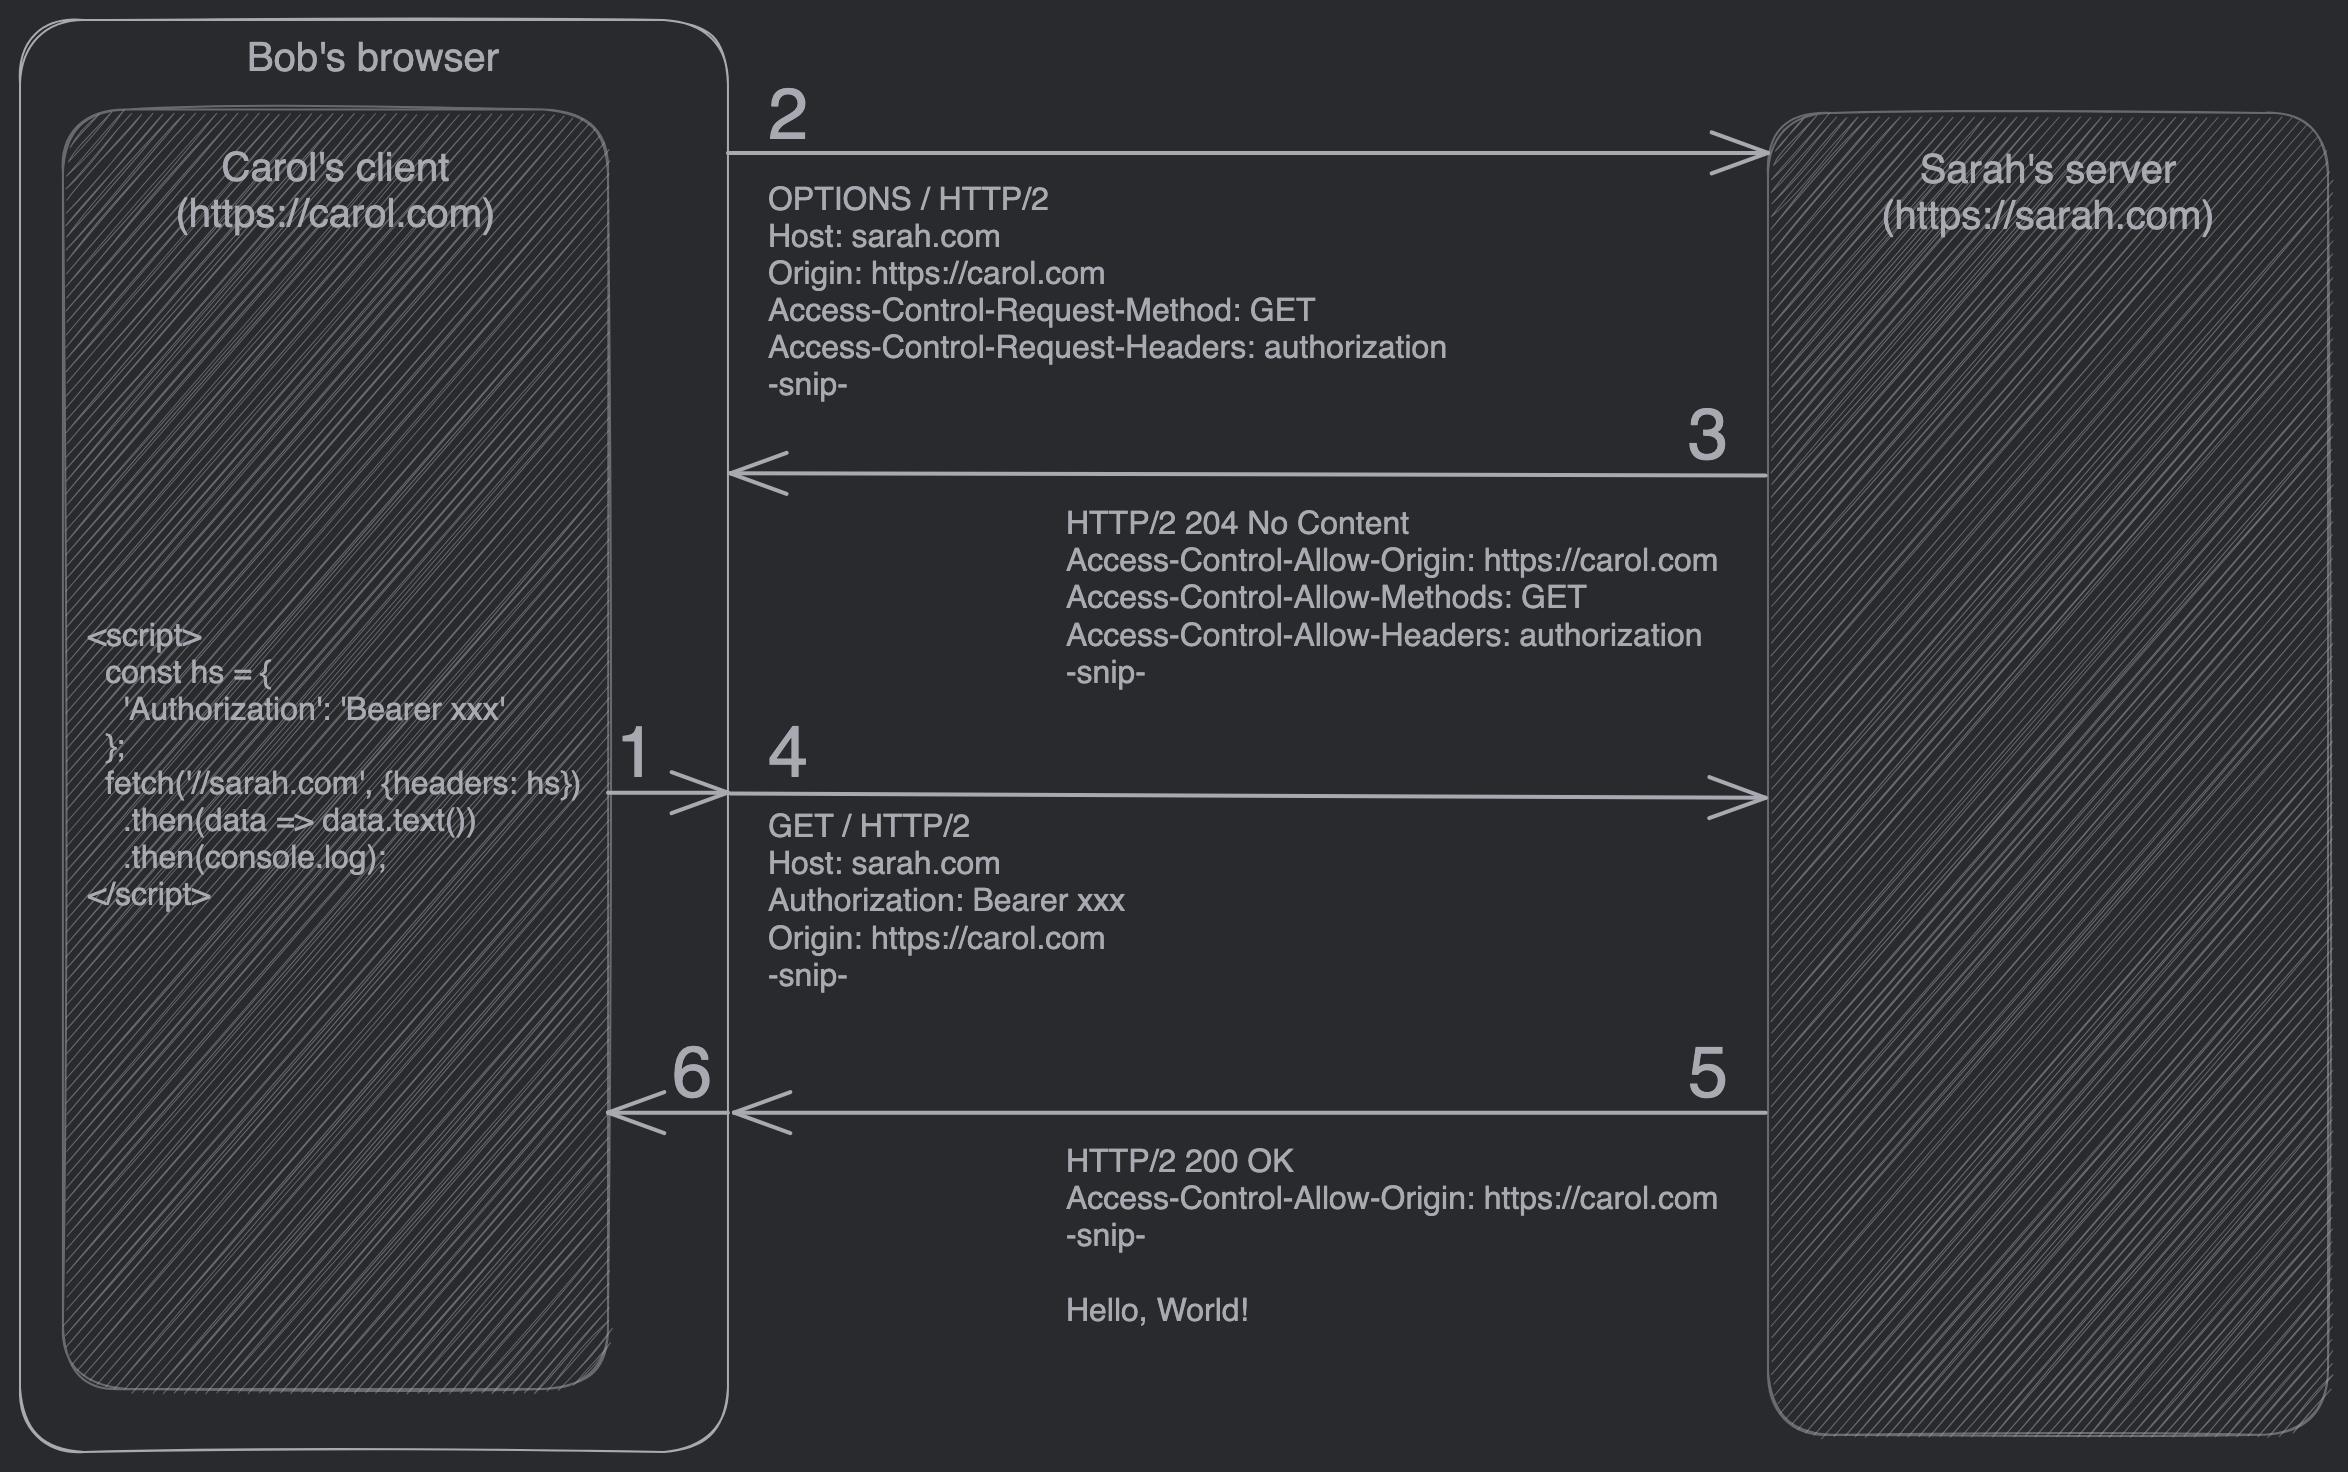
You can view the browser as some intermediary between the client (which initiates the actual request) and the server. The diagram below (borrowed from elsewhere) illustrates the ordering of the preflight and actual requests:
- The client first initiates a cross-origin request (which happens not to be simple);
- The browser queues (or "pauses") the actual request and sends a preflight request.
![CORS-preflight fetch]()
You can see that
- the actual request starts (1) before the preflight request starts (2), but
- the actual request is sent (4), if preflight succeeds of course, and hence ends (6) only after the preflight request has ended (3).
An experiment
- Open Chrome's DevTools on this very page.
- Go to the Console tab and execute the following code:
fetch('https://www.example.com', {method: "PUT"})
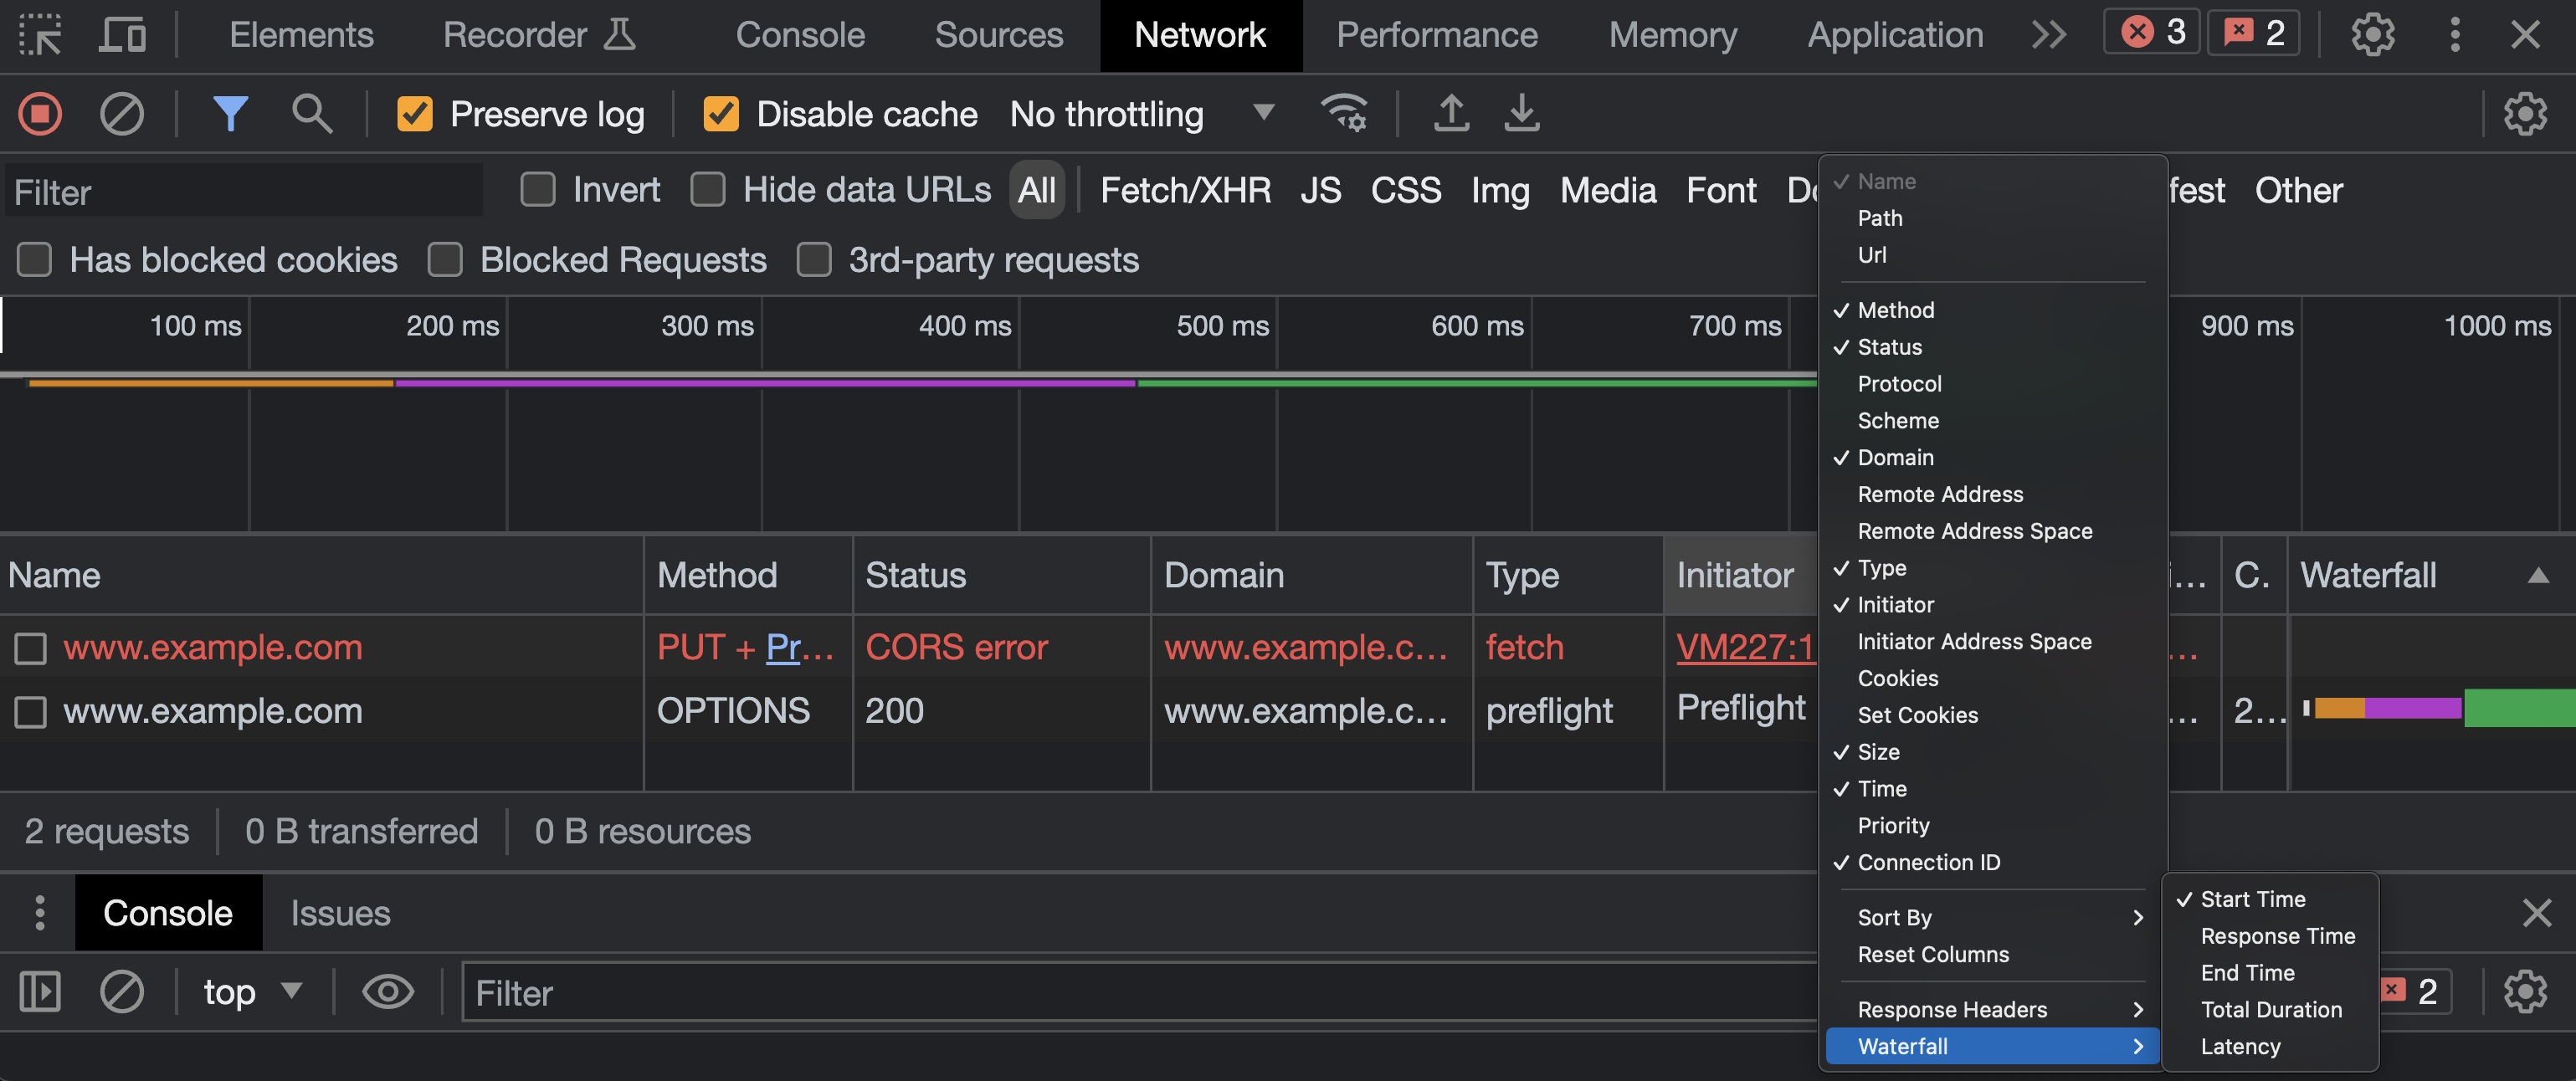
- Go the Network tab. Notice that requests are
sorted by ascending order of their start time.
Accordingly, the preflight request is at the bottom.
![Sorted by start time]()
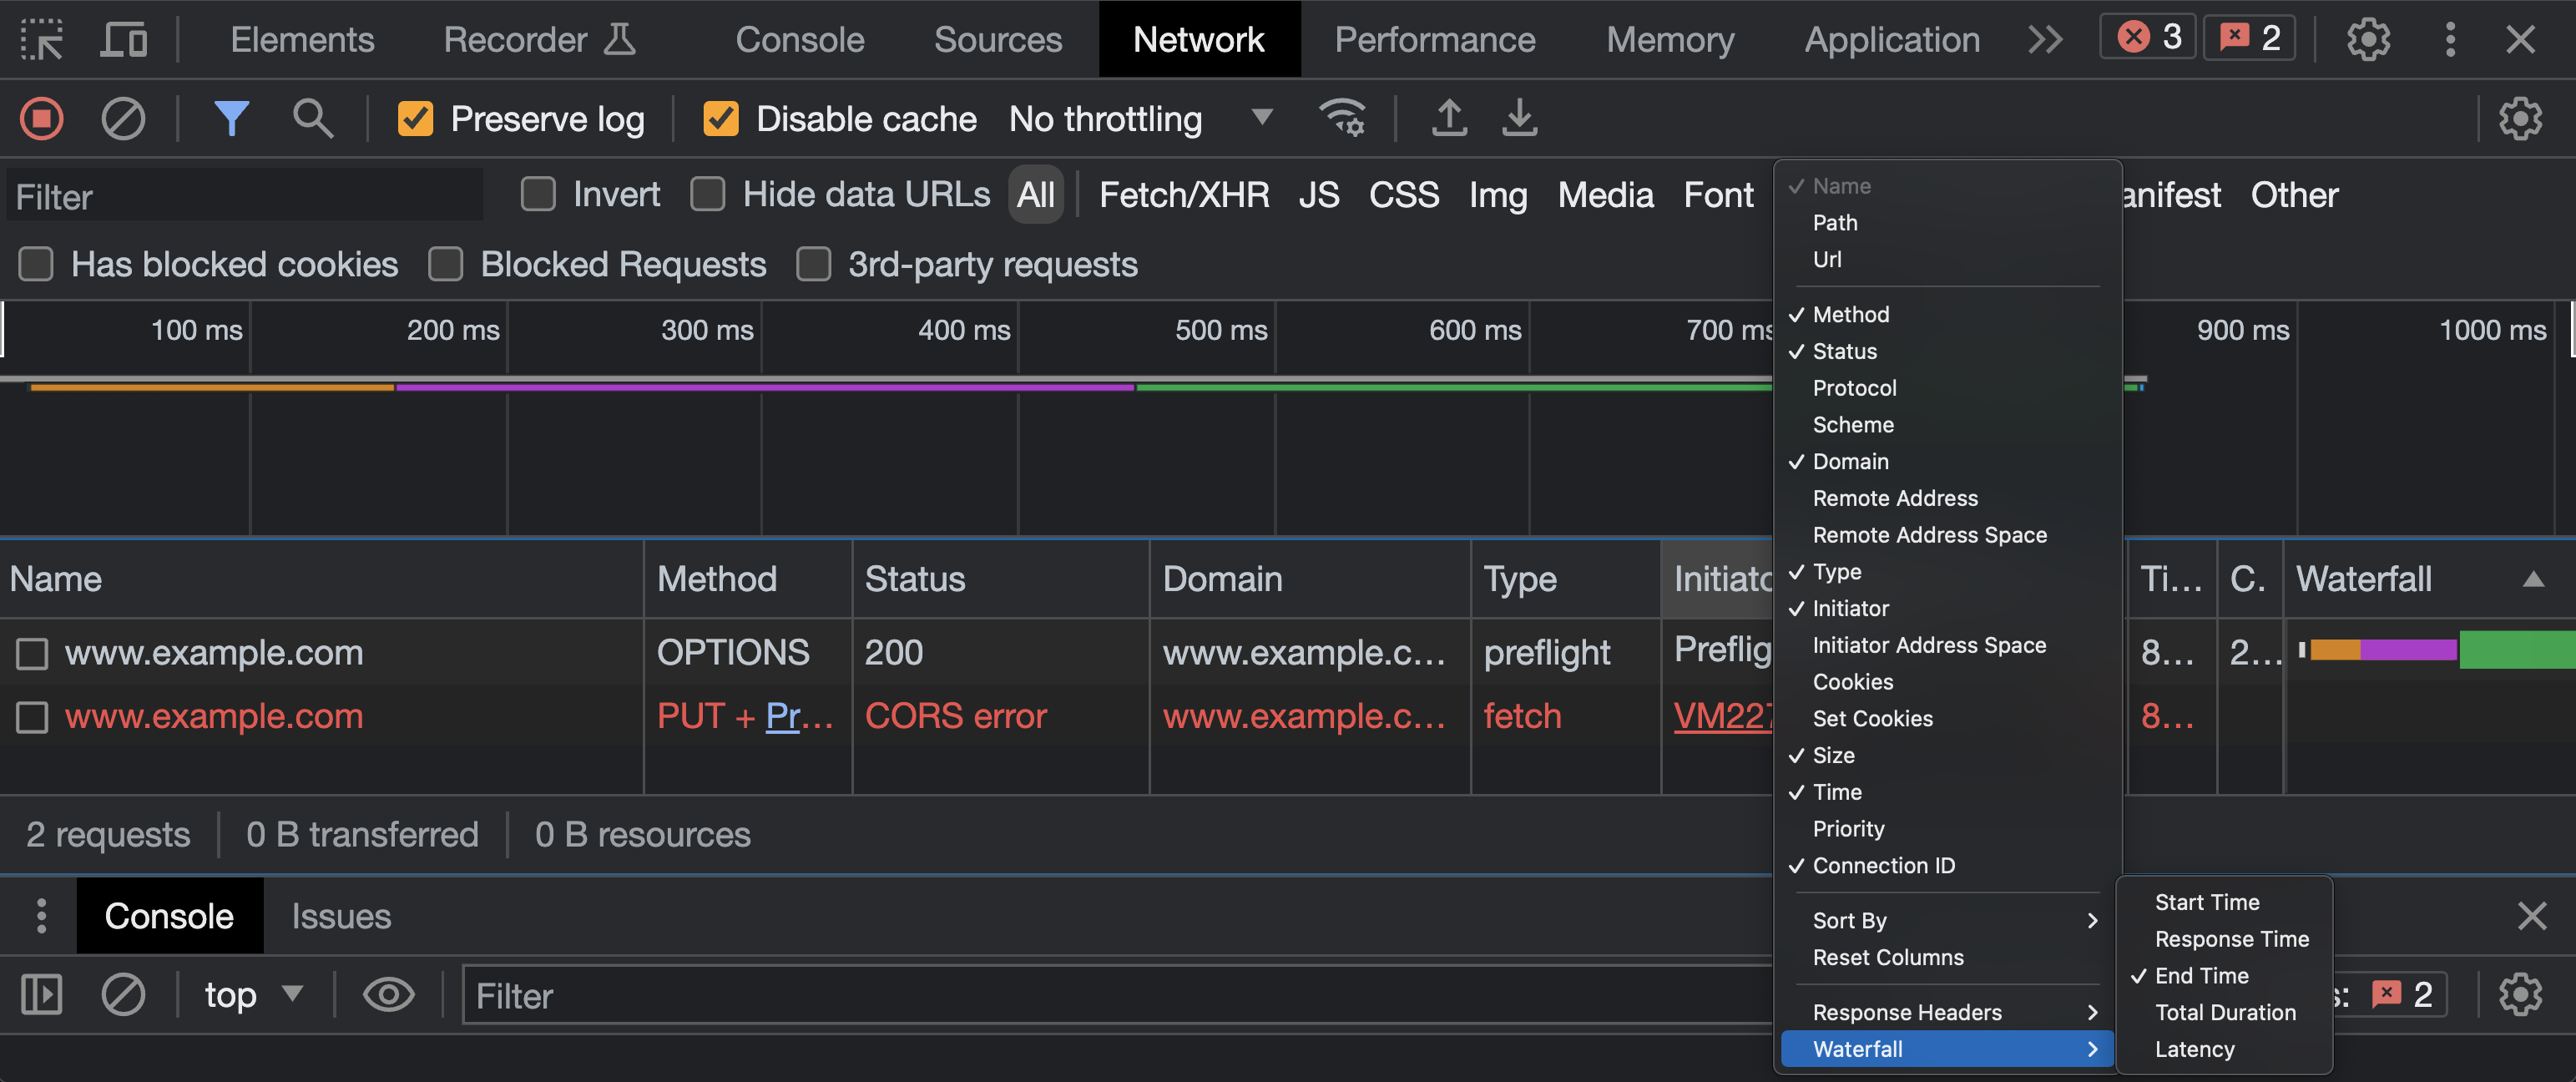
- Now right-click on any column header and select Waterfall > End time. Notice that the the preflight request is now at the top.
![Sorted by end time]()


