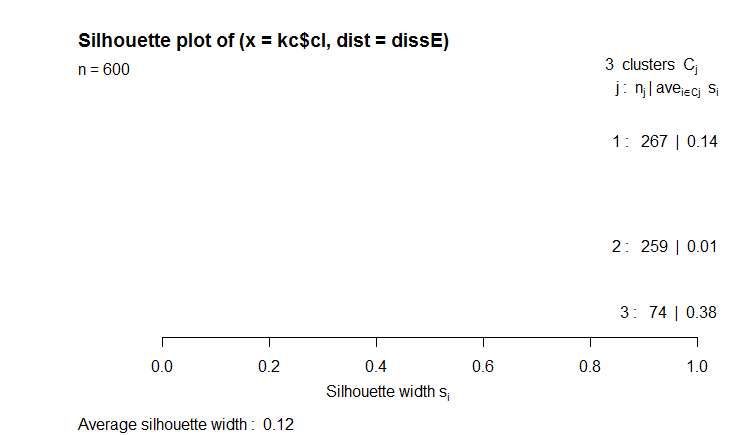
everyone. I have a problem in plotting silhouette chart in R.
It is my code.
#k-means clustering
#install.packages("cluster")
library(cluster)
kc <- kmeans(nsoap, centers=3)

dissE <- daisy(nsoap)
sk <- silhouette(kc$cl,dissE)

plot(sk)
dev.off()
I just got this result. It is without the contents...
How can I overcome this problem?
Thank you:)

