How to draw "two directions widths line" in matplotlib
Asked Answered
K

3

6

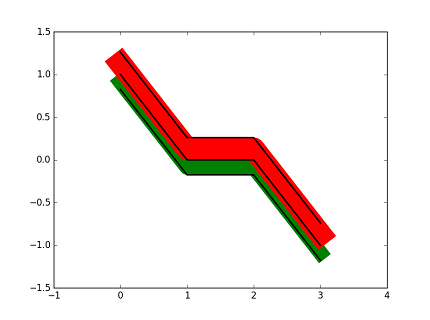
How to use matplotlib or pyqtgraph draw plot like this: two dirrections widths line
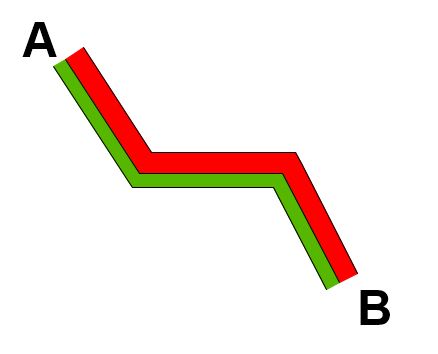
Line AB is a two-directions street, green part represents the direction from point A to point B, red part represents B to A, width of each part represents the traffic volume. Widths are measured in point, will not changed at different zoom levels or dpi settings.

This is only an example, in fact I have hunderds of streets. This kind of plot is very common in many traffic softwares. I tried to use matplotlib's patheffect but result is frustrated:

from matplotlib import pyplot as plt
import matplotlib.patheffects as path_effects

x=[0,1,2,3]
y=[1,0,0,-1]
ab_width=20
ba_width=30

fig, axes= plt.subplots(1,1)
center_line, = axes.plot(x,y,color='k',linewidth=2)

center_line.set_path_effects(
[path_effects.SimpleLineShadow(offset=(0, -ab_width/2),shadow_color='g', alpha=1, linewidth=ab_width),
path_effects.SimpleLineShadow(offset=(0, ba_width/2), shadow_color='r', alpha=1, linewidth=ba_width),
path_effects.SimpleLineShadow(offset=(0, -ab_width), shadow_color='k', alpha=1, linewidth=2),
path_effects.SimpleLineShadow(offset=(0, ba_width), shadow_color='k', alpha=1, linewidth=2),
path_effects.Normal()])

axes.set_xlim(-1,4)
axes.set_ylim(-1.5,1.5)

enter image description here

One idea came to me is to take each part of the line as a standalone line, and recalculate it's position when changing zoom level, but it's too complicated and slow.

If there any easy way to use matplotlib or pyqtgraph draw what I want? Any suggestion will be appreciated!

Karajan answered 10/6, 2016 at 4:53 Comment(5)
Your figures are not workingBerger
Sorry, I repair it.@BergerKarajan
Nope, still not working.. Why not use the image uploader provided by stackoverflow?Berger
See e.g. stackoverflow.com/a/28497025/3581217Berger
Thank you, I didn't know this.@BergerKarajan
E
1

Many years later, I figured it out! Do do it, one has to create a new Path Effect which performs the necessary rendering:

class MultilinePath(AbstractPathEffect):
def __init__(self, offset=(0, 0), part_widths=(1,), part_colors=('b',), **kwargs):
    super().__init__(offset=(0, 0))
    self._path_colors = [mcolors.to_rgba(color) for color in part_colors]
    self._path_widths = np.array(part_widths)
    self._path_offsets = np.cumsum(self._path_widths) - self._path_widths/2 - np.sum(self._path_widths)/2
    self._gc = kwargs

def draw_path(self, renderer, gc, tpath, affine, rgbFace=None):
    """
    Overrides the standard draw_path to instead draw several paths slightly offset
    """
    gc0 = renderer.new_gc()  # Don't modify gc, but a copy!
    gc0.copy_properties(gc)

    gc0 = self._update_gc(gc0, self._gc)
    offset_px = renderer.points_to_pixels(self._path_offsets*gc0.get_linewidth())
    base_linewidth = renderer.points_to_pixels(gc0.get_linewidth())
    # Transform before evaluation because to_polygons works at resolution
    # of one -- assuming it is working in pixel space.
    transpath = affine.transform_path(tpath)
    # Evaluate to straight line segments to we can get the normal
    polys = transpath.to_polygons(closed_only=False)
    for p in polys:
        x = p[:, 0]
        y = p[:, 1]

        # Can not interpolate points or draw line if only one point in
        # polyline.
        if x.size < 2:
            continue

        dx = np.concatenate([[x[1] - x[0]], x[2:] - x[:-2], [x[-1] - x[-2]]])
        dy = np.concatenate([[y[1] - y[0]], y[2:] - y[:-2], [y[-1] - y[-2]]])
        l = np.hypot(dx, dy)
        nx = dy / l
        ny = -dx / l

        for i, width in enumerate(self._path_widths):
            xyt = np.copy(p)
            xyt[:, 0] += nx * offset_px[i]
            xyt[:, 1] += ny * offset_px[i]

            h = Path(xyt)
            # Transform back to data space during render
            gc0.set_linewidth(width * base_linewidth)
            gc0.set_foreground(self._path_colors[i])

            renderer.draw_path(gc0, h, trf.IdentityTransform(), rgbFace)

    gc0.restore()

And then you can just apply it to any path rendered by matplotlib. For example:

nx = 101
x = np.linspace(0.0, 1.0, nx)
y = 0.3*np.sin(x*8) + 0.4
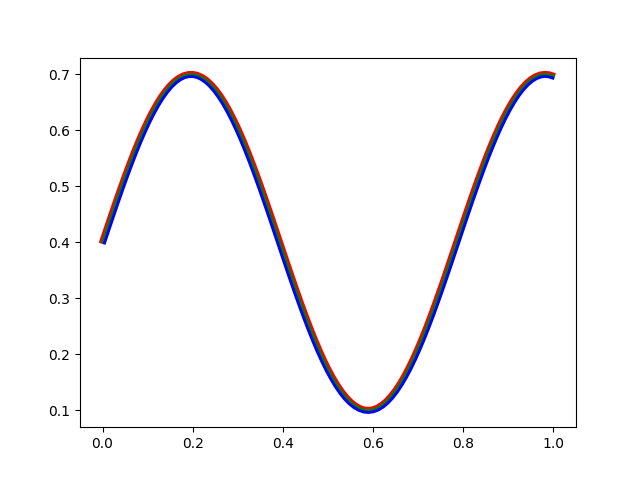
ax.plot(x, y, label="Curve", path_effects=[MultilinePath(part_widths=[1, 1, 1], part_colors=['r', 'g', 'b'])])
plt.show()

Sine Curve of three paths next to each other

Ethelethelbert answered 14/3 at 16:9 Comment(0)
V
4

If you can have each independent line, this can be done easily with the fill_between function.

from matplotlib import pyplot as plt
import numpy as np

x=np.array([0,1,2,3])
y=np.array([1,0,0,-1])

y1width=-1
y2width=3
y1 = y + y1width
y2 = y + y2width

fig = plt.figure()
ax = fig.add_subplot(111)

plt.plot(x,y, 'k', x,y1, 'k',x,y2, 'k',linewidth=2)
ax.fill_between(x, y1, y, color='g')
ax.fill_between(x, y2, y, color='r')

plt.xlim(-1,4)
plt.ylim(-3,6)
plt.show()

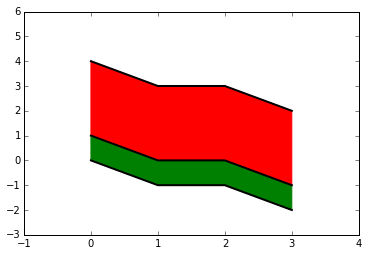
Here I considered the center line as the reference (thus the negative y1width), but could be done differently. The result is then:

<code>fill_between</code> result.

If the lines are 'complicated', eventually intersecting at some point, then the keyword argument interpolate=True must be used to fill the crossover regions properly. Another interesting argument probably useful for your use case is where, to condition the region, for instance, where=y1 < 0. For more information you can check out the documentation.

Vipul answered 16/6, 2016 at 13:56 Comment(2)
Thanks for your answer, but you may not fully understand my demand. The width should be measured in point, and will not changed at different zoom levels. It is used in an interactive application, user often need to zoom in and out and pan to observe different line. In your answer, widths are not fixed after zoom. Also a little difference in endpoints.Karajan
True, I did not get the part of "constant width". For that purpose you need to catch the zooming event, set an appropriate scale for the shading (by increasing or decreasing the original widths) and re-draw. Follow this gist to see something related (related, not exactly what you are looking for). As for the endings that is where this fill_between approach cannot help anymore.Vipul
F
3

One way of solving your issue is using filled polygons, some linear algebra and some calculus. The main idea is to draw a polygon along your x and y coordinates and along shifted coordinates to close and fill the polygon.

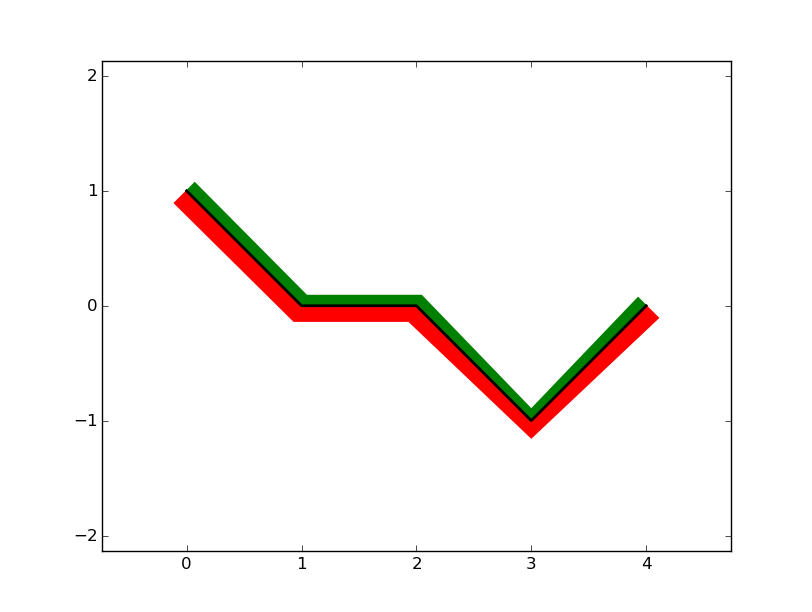
These are my results: Filled polygons along path

And here is the code:

from __future__ import division
import numpy
from matplotlib import pyplot, patches


def road(x, y, w, scale=0.005, **kwargs):
    # Makes sure input coordinates are arrays.
    x, y = numpy.asarray(x, dtype=float), numpy.asarray(y, dtype=float)
    # Calculate derivative.
    dx = x[2:] - x[:-2]
    dy = y[2:] - y[:-2]
    dy_dx = numpy.concatenate([
        [(y[1] - y[0]) / (x[1] - x[0])],
        dy / dx,
        [(y[-1] - y[-2]) / (x[-1] - x[-2])]
    ])
    # Offsets the input coordinates according to the local derivative.
    offset = -dy_dx + 1j
    offset =  w * scale * offset / abs(offset)
    y_offset = y + w * scale
    #
    AB = zip(
        numpy.concatenate([x + offset.real, x[::-1]]),
        numpy.concatenate([y + offset.imag, y[::-1]]),
    )
    p = patches.Polygon(AB, **kwargs)

    # Returns polygon.
    return p


if __name__ == '__main__':
    # Some plot initializations
    pyplot.close('all')
    pyplot.ion()

    # This is the list of coordinates of each point
    x = [0, 1, 2, 3, 4]
    y = [1, 0, 0, -1, 0]

    # Creates figure and axes.
    fig, ax = pyplot.subplots(1,1)
    ax.axis('equal')
    center_line, = ax.plot(x, y, color='k', linewidth=2)

    AB = road(x, y, 20, color='g')
    BA = road(x, y, -30, color='r')
    ax.add_patch(AB)
    ax.add_patch(BA)

The first step in calculating how to offset each data point is by calculating the discrete derivative dy / dx. I like to use complex notation to handle vectors in Python, i.e. A = 1 - 1j. This makes life easier for some mathematical operations.

The next step is to remember that the derivative gives the tangent to the curve and from linear algebra that the normal to the tangent is n=-dy_dx + 1j, using complex notation.

The final step in determining the offset coordinates is to ensure that the normal vector has unity size n_norm = n / abs(n) and multiply by the desired width of the polygon.

Now that we have all the coordinates for the points in the polygon, the rest is quite straightforward. Use patches.Polygon and add them to the plot.

This code allows you also to define if you want the patch on top of your route or below it. Just give a positive or negative value for the width. If you want to change the width of the polygon depending on your zoom level and/or resolution, you adjust the scale parameter. It also gives you freedom to add additional parameters to the patches such as fill patterns, transparency, etc.

Fontes answered 19/6, 2016 at 1:15 Comment(1)
Excellent! But still can't solve the "weight no change after zooming" problem. Maybe there is no directive way to use matplotlib to solve the problem. I need to catch the zooming event, re-calculate and re-draw it.Karajan
E
1

Many years later, I figured it out! Do do it, one has to create a new Path Effect which performs the necessary rendering:

class MultilinePath(AbstractPathEffect):
def __init__(self, offset=(0, 0), part_widths=(1,), part_colors=('b',), **kwargs):
    super().__init__(offset=(0, 0))
    self._path_colors = [mcolors.to_rgba(color) for color in part_colors]
    self._path_widths = np.array(part_widths)
    self._path_offsets = np.cumsum(self._path_widths) - self._path_widths/2 - np.sum(self._path_widths)/2
    self._gc = kwargs

def draw_path(self, renderer, gc, tpath, affine, rgbFace=None):
    """
    Overrides the standard draw_path to instead draw several paths slightly offset
    """
    gc0 = renderer.new_gc()  # Don't modify gc, but a copy!
    gc0.copy_properties(gc)

    gc0 = self._update_gc(gc0, self._gc)
    offset_px = renderer.points_to_pixels(self._path_offsets*gc0.get_linewidth())
    base_linewidth = renderer.points_to_pixels(gc0.get_linewidth())
    # Transform before evaluation because to_polygons works at resolution
    # of one -- assuming it is working in pixel space.
    transpath = affine.transform_path(tpath)
    # Evaluate to straight line segments to we can get the normal
    polys = transpath.to_polygons(closed_only=False)
    for p in polys:
        x = p[:, 0]
        y = p[:, 1]

        # Can not interpolate points or draw line if only one point in
        # polyline.
        if x.size < 2:
            continue

        dx = np.concatenate([[x[1] - x[0]], x[2:] - x[:-2], [x[-1] - x[-2]]])
        dy = np.concatenate([[y[1] - y[0]], y[2:] - y[:-2], [y[-1] - y[-2]]])
        l = np.hypot(dx, dy)
        nx = dy / l
        ny = -dx / l

        for i, width in enumerate(self._path_widths):
            xyt = np.copy(p)
            xyt[:, 0] += nx * offset_px[i]
            xyt[:, 1] += ny * offset_px[i]

            h = Path(xyt)
            # Transform back to data space during render
            gc0.set_linewidth(width * base_linewidth)
            gc0.set_foreground(self._path_colors[i])

            renderer.draw_path(gc0, h, trf.IdentityTransform(), rgbFace)

    gc0.restore()

And then you can just apply it to any path rendered by matplotlib. For example:

nx = 101
x = np.linspace(0.0, 1.0, nx)
y = 0.3*np.sin(x*8) + 0.4
ax.plot(x, y, label="Curve", path_effects=[MultilinePath(part_widths=[1, 1, 1], part_colors=['r', 'g', 'b'])])
plt.show()

Sine Curve of three paths next to each other

Ethelethelbert answered 14/3 at 16:9 Comment(0)

© 2022 - 2024 — McMap. All rights reserved.