Empty colorbar using basemap.pcolor in an ImageGrid
Asked Answered
L

2

6

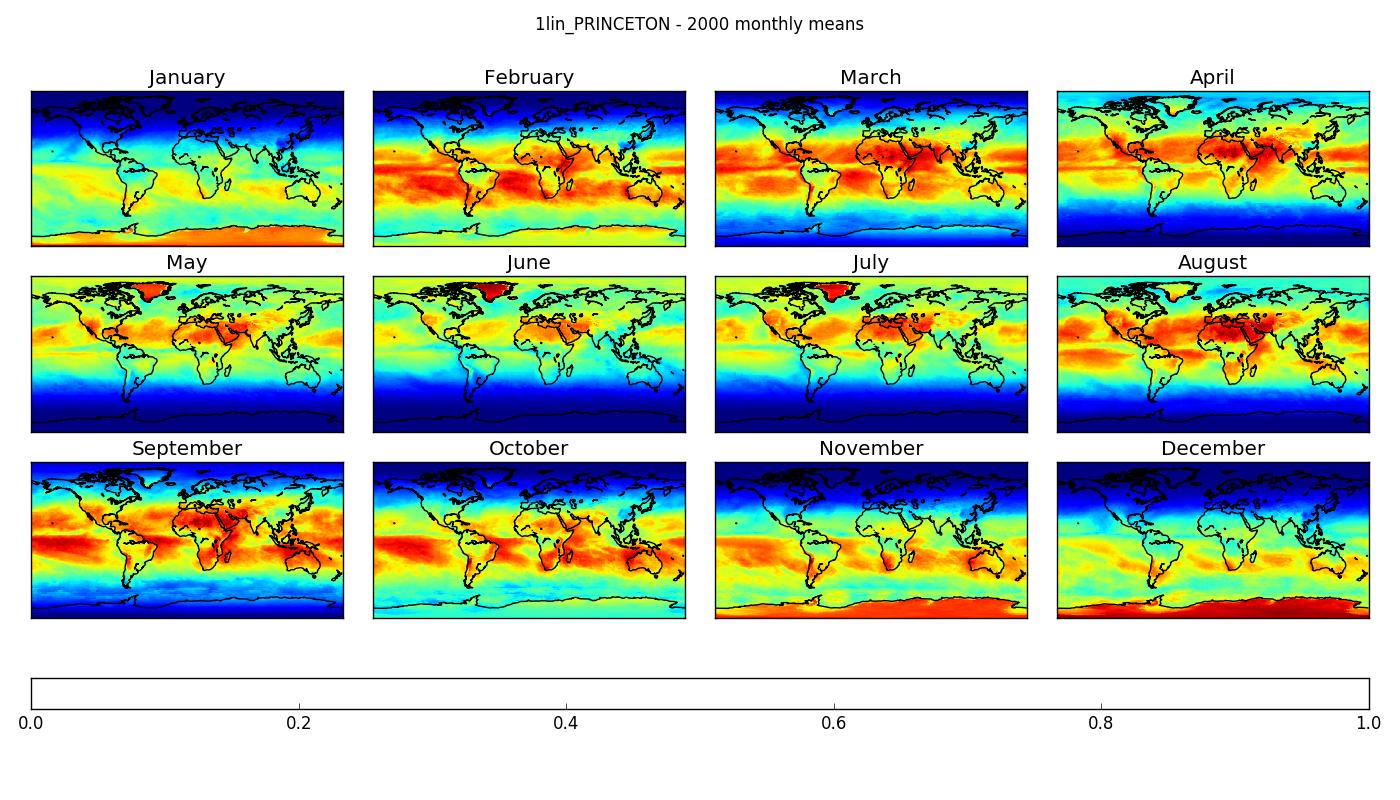
The following code produces the image I want, but the colourbar is blank/white, and doesn't match the data:

def plot_array(da, ax=None, shift=True):
    """plots an array of lat by lon on a coastline map"""

    m = basemap.Basemap()
    m.drawcoastlines()
    m.pcolormesh(da.lon, y=da.lat, data=da.T, latlon=True)

    return m

# 'monthly mean' is an xarray DataArray

fig = plt.figure(0, (14, 8))
grid = ImageGrid(fig, 111, nrows_ncols=(3, 4), axes_pad=0.3,
                 cbar_mode='single', cbar_location="bottom",)
for i, m in enumerate(months):
    plt.sca(grid[i])
    plot_array(monthly_mean.sel(month=i + 1))
    plt.title(m)
plt.suptitle("{b} - {y} monthly means".format(b=benchmark, y=year))
# plt.colorbar()
plt.tight_layout()

os.makedirs("plots/monthly_means/{y}".format(y=year), exist_ok=True)
plt.savefig("plots/monthly_means/{y}/{b}_{y}.png".format(b=benchmark, y=year))
plt.close()

blank colorbar

Is there something else I need to do to get the colorbar working with ImageGrid, or do ImageGrid and Basemap just not play well together?

Leah answered 20/6, 2016 at 7:56 Comment(0)
C
4

As far as I understand, it's not a Basemap problem. The ImageGrid() call just sets up a blank set of axes for the colorbar that can be passed to plt.colorbar() via the cax argument. By default ImageGrid() has the argument cbar_set_cax=True, which sets the cax attribute on each of the subplots. You can then pass this to colorbar():

...
plt.colorbar(cax=grid[0].cax)
plt.tight_layout()
...

That will just use the currently active axes to determine the colorbar data range, so it'll only be consistent with the final plot. You're going to have to use combinations of vmin/vmax with pcolormesh() to ensure consistency across all the plots.

Cosmos answered 20/6, 2016 at 11:33 Comment(3)
when I try to use plt.colorbar(cax=grid[0].cax), I get an error: RuntimeError: No mappable was found to use for colorbar creation. First define a mappable such as an image (with imshow) or a contour set (with contourf). and if I try plt.colorbar(plt.gca(), cax=grid[0].cax) I get the error AttributeError: 'CbarAxes' object has no attribute 'autoscale_None' Finally, if I try plt.colorbar(grid[0],cax=grid[0].cax) I get the error AttributeError: 'LocatableAxes' object has no attribute 'autoscale_None Any idea how to fix this?Semiyearly
Using Serentiy's answer below fixes this issueSemiyearly
@user2472441 Probably sort of. That plt.colorbar(pcm) is adding a new colorbar instance rather than replacing the one already established by ImageGrid. The original blank one is still there underneath the new one - try setting orientation="vertical" in the colorbar call to see them both. If you don't replace the original one it may be visible with some figure sizes.Cosmos
J
4

Matplotlib can not define what you want to plot on a colorbar. Write like

...
pcm = m.pcolormesh(da.lon, y=da.lat, data=da.T, latlon=True)
plt.colorbar(pcm)
...
Jeminah answered 20/6, 2016 at 11:3 Comment(0)
C
4

As far as I understand, it's not a Basemap problem. The ImageGrid() call just sets up a blank set of axes for the colorbar that can be passed to plt.colorbar() via the cax argument. By default ImageGrid() has the argument cbar_set_cax=True, which sets the cax attribute on each of the subplots. You can then pass this to colorbar():

...
plt.colorbar(cax=grid[0].cax)
plt.tight_layout()
...

That will just use the currently active axes to determine the colorbar data range, so it'll only be consistent with the final plot. You're going to have to use combinations of vmin/vmax with pcolormesh() to ensure consistency across all the plots.

Cosmos answered 20/6, 2016 at 11:33 Comment(3)
when I try to use plt.colorbar(cax=grid[0].cax), I get an error: RuntimeError: No mappable was found to use for colorbar creation. First define a mappable such as an image (with imshow) or a contour set (with contourf). and if I try plt.colorbar(plt.gca(), cax=grid[0].cax) I get the error AttributeError: 'CbarAxes' object has no attribute 'autoscale_None' Finally, if I try plt.colorbar(grid[0],cax=grid[0].cax) I get the error AttributeError: 'LocatableAxes' object has no attribute 'autoscale_None Any idea how to fix this?Semiyearly
Using Serentiy's answer below fixes this issueSemiyearly
@user2472441 Probably sort of. That plt.colorbar(pcm) is adding a new colorbar instance rather than replacing the one already established by ImageGrid. The original blank one is still there underneath the new one - try setting orientation="vertical" in the colorbar call to see them both. If you don't replace the original one it may be visible with some figure sizes.Cosmos

© 2022 - 2024 — McMap. All rights reserved.