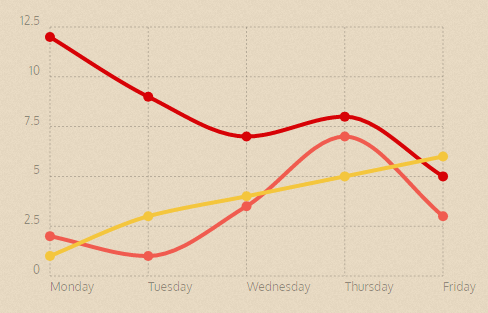
I'm currently using Chartist.js, But I can't change the default line colors of Chart.
Chartist.js

For SIMPLE LINE CHART I've tried:
.ct-series-a .ct-line{
    background-color: blue;
}
But It brings no result. How to fix this?
I'm currently using Chartist.js, But I can't change the default line colors of Chart.
Chartist.js

For SIMPLE LINE CHART I've tried:
.ct-series-a .ct-line{
background-color: blue;
}
But It brings no result. How to fix this?
Try this:
.ct-series-a .ct-line {
  /* Set the colour of this series line */
  stroke: red;
  /* Control the thikness of your lines */
  stroke-width: 5px;
  /* Create a dashed line with a pattern */
  stroke-dasharray: 10px 20px;
}
https://gionkunz.github.io/chartist-js/getting-started.html#customizing-the-default-css
© 2022 - 2024 — McMap. All rights reserved.