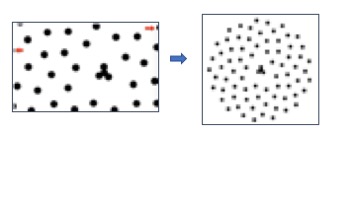
I have a large number of nodes to display on the page, most of the times the circles goes off the visible area of the screen due to node placements.
Is there a way to set the initial zoom level based on the whole boundary box of nodes dynamically so that all the nodes fits on the visible area of the screen?
Updated:
I have added a fiddle for this https://jsfiddle.net/navinleon/6ygaxoyq/3/
var svg = d3.select("svg"),
    width = +svg.attr("width"),
    height = +svg.attr("height");


  var zoom = d3.zoom()
    .scaleExtent([-8 / 2, 4])
    .on("zoom", zoomed);

    svg.call(zoom);

  var g = svg.append("g");

  var simulation = d3.forceSimulation()
    .force("link", d3.forceLink().id(function(d) {
      return d.id;
    }))
    .force("charge", d3.forceManyBody())
    .force("center", d3.forceCenter(width / 2, height / 2));

  var graph = {
    "nodes": [{
      "id": "Myriel",
      "group": 1
    }, {
      "id": "Napoleon",
      "group": 1
    }, {
      "id": "Mlle.Baptistine",
      "group": 1
    }, {
      "id": "Mme.Magloire",
      "group": 1
    }, {
      "id": "CountessdeLo",
      "group": 1
    }, {
      "id": "Geborand",
      "group": 1
    }, {
      "id": "Champtercier",
      "group": 1
    }, {
      "id": "Cravatte",
      "group": 1
    }, {
      "id": "Count",
      "group": 1
    }, {
      "id": "OldMan",
      "group": 1
    }, {
      "id": "Labarre",
      "group": 2
    }, {
      "id": "Valjean",
      "group": 2
    }, {
      "id": "Marguerite",
      "group": 3
    }, {
      "id": "Mme.deR",
      "group": 2
    }, {
      "id": "Isabeau",
      "group": 2
    }, {
      "id": "Gervais",
      "group": 2
    }, {
      "id": "Tholomyes",
      "group": 3
    }, {
      "id": "Listolier",
      "group": 3
    }, {
      "id": "Fameuil",
      "group": 3
    }, {
      "id": "Blacheville",
      "group": 3
    }, {
      "id": "Favourite",
      "group": 3
    }, {
      "id": "Dahlia",
      "group": 3
    }, {
      "id": "Zephine",
      "group": 3
    }, {
      "id": "Fantine",
      "group": 3
    }, {
      "id": "Mme.Thenardier",
      "group": 4
    }, {
      "id": "Thenardier",
      "group": 4
    }, {
      "id": "Cosette",
      "group": 5
    }, {
      "id": "Javert",
      "group": 4
    }, {
      "id": "Fauchelevent",
      "group": 0
    }, {
      "id": "Bamatabois",
      "group": 2
    }, {
      "id": "Perpetue",
      "group": 3
    }, {
      "id": "Simplice",
      "group": 2
    }, {
      "id": "Scaufflaire",
      "group": 2
    }, {
      "id": "Woman1",
      "group": 2
    }, {
      "id": "Judge",
      "group": 2
    }, {
      "id": "Champmathieu",
      "group": 2
    }, {
      "id": "Brevet",
      "group": 2
    }, {
      "id": "Chenildieu",
      "group": 2
    }, {
      "id": "Cochepaille",
      "group": 2
    }, {
      "id": "Pontmercy",
      "group": 4
    }, {
      "id": "Boulatruelle",
      "group": 6
    }, {
      "id": "Eponine",
      "group": 4
    }, {
      "id": "Anzelma",
      "group": 4
    }, {
      "id": "Woman2",
      "group": 5
    }, {
      "id": "MotherInnocent",
      "group": 0
    }, {
      "id": "Gribier",
      "group": 0
    }, {
      "id": "Jondrette",
      "group": 7
    }, {
      "id": "Mme.Burgon",
      "group": 7
    }, {
      "id": "Gavroche",
      "group": 8
    }, {
      "id": "Gillenormand",
      "group": 5
    }, {
      "id": "Magnon",
      "group": 5
    }, {
      "id": "Mlle.Gillenormand",
      "group": 5
    }, {
      "id": "Mme.Pontmercy",
      "group": 5
    }, {
      "id": "Mlle.Vaubois",
      "group": 5
    }, {
      "id": "Lt.Gillenormand",
      "group": 5
    }, {
      "id": "Marius",
      "group": 8
    }, {
      "id": "BaronessT",
      "group": 5
    }, {
      "id": "Mabeuf",
      "group": 8
    }, {
      "id": "Enjolras",
      "group": 8
    }, {
      "id": "Combeferre",
      "group": 8
    }, {
      "id": "Prouvaire",
      "group": 8
    }, {
      "id": "Feuilly",
      "group": 8
    }, {
      "id": "Courfeyrac",
      "group": 8
    }, {
      "id": "Bahorel",
      "group": 8
    }, {
      "id": "Bossuet",
      "group": 8
    }, {
      "id": "Joly",
      "group": 8
    }, {
      "id": "Grantaire",
      "group": 8
    }, {
      "id": "MotherPlutarch",
      "group": 9
    }, {
      "id": "Gueulemer",
      "group": 4
    }, {
      "id": "Babet",
      "group": 4
    }, {
      "id": "Claquesous",
      "group": 4
    }, {
      "id": "Montparnasse",
      "group": 4
    }, {
      "id": "Toussaint",
      "group": 5
    }, {
      "id": "Child1",
      "group": 10
    }, {
      "id": "Child2",
      "group": 10
    }, {
      "id": "Brujon",
      "group": 4
    }, {
      "id": "Mme.Hucheloup",
      "group": 8
    }],
    "links": [{
      "source": "Napoleon",
      "target": "Myriel",
      "value": 1
    }, {
      "source": "Mlle.Baptistine",
      "target": "Myriel",
      "value": 8
    }, {
      "source": "Mme.Magloire",
      "target": "Myriel",
      "value": 10
    }]
  }

  var link = g.append("g")
    .attr("class", "links")
    .selectAll("line")
    .data(graph.links)
    .enter().append("line");

  var node = g.append("g")
    .attr("class", "nodes")
    .selectAll("circle")
    .data(graph.nodes)
    .enter().append("circle")
    .attr("r", 2.5)
    .on('click', clicked);

  node.append("title")
    .text(function(d) {
      return d.id;
    });

  simulation
    .nodes(graph.nodes)
    .on("tick", ticked);

  simulation.force("link")
    .links(graph.links);

  function ticked() {
    link
      .attr("x1", function(d) {
        return d.source.x;
      })
      .attr("y1", function(d) {
        return d.source.y;
      })
      .attr("x2", function(d) {
        return d.target.x;
      })
      .attr("y2", function(d) {
        return d.target.y;
      });

    node
      .attr("cx", function(d) {
        return d.x;
      })
      .attr("cy", function(d) {
        return d.y;
      })
      .attr('r',20)
  }

  var active = d3.select(null);

  function clicked(d) {

    if (active.node() === this){
      active.classed("active", false);
      return reset();
    }

    active = d3.select(this).classed("active", true);

    svg.transition()
      .duration(750)
      .call(zoom.transform,
        d3.zoomIdentity
        .translate(width / 2, height / 2)
        .scale(8)
        .translate(-(+active.attr('cx')), -(+active.attr('cy')))
      );
  }

  function reset() {
    svg.transition()
      .duration(750)
      .call(zoom.transform,
        d3.zoomIdentity
        .translate(0, 0)
        .scale(1)
      );
  }

  function zoomed() {
    g.attr("transform", d3.event.transform);
  }
<script src="https://d3js.org/d3.v5.min.js"></script>
<svg width="960" height="600"></svg>Expected:

