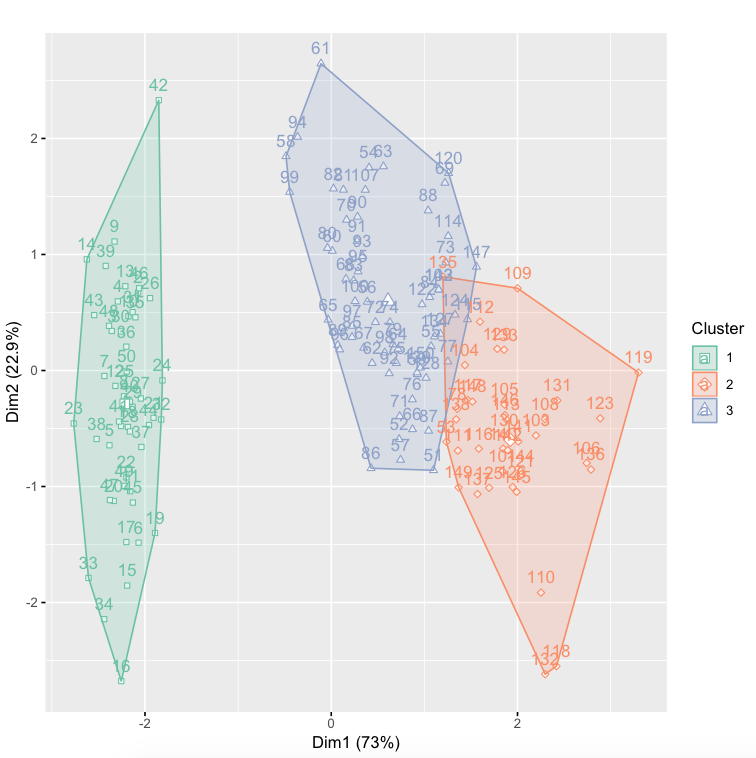
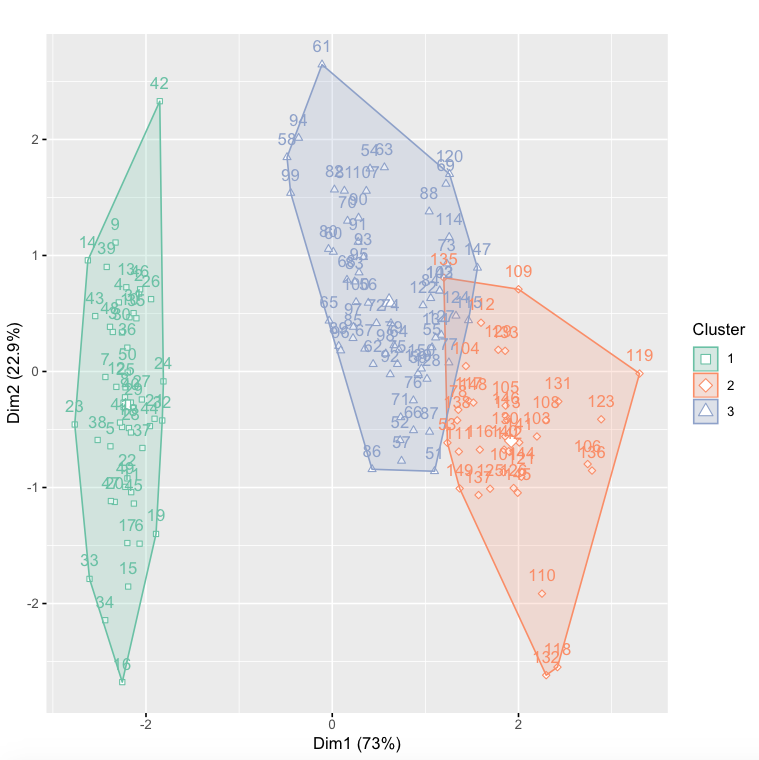
I would like to change the results of my fviz_clust plot. Specifically, change the legend to say "Cluster" instead of "cluster", but also remove the curly lines found within the legend (I think they are letters, but not entirely sure).
I know fviz_cluster works with other elements in ggplot. Therefore my first thought was to change the legend title within each scale_..._.. of my plot, but that still resulted in the original legend displaying. Secondly, I thought I could introduce a scale_shape_manual() object to ggplot but the plot ignored it.
Code:
km.res <- kmeans(iris[,-5], 3)
p <- fviz_cluster(km.res, iris[,-5]) +
scale_color_brewer(palette='Set2') + # set guides=FALSE to remove legend
scale_fill_brewer(palette='Set2') +
scale_shape_manual('1'=22,'2'=23,'3'=24) # plot ignores this
ggtitle(label='')
p
Ideally I would like to show a very similar legend to what fviz_cluster produces, but with the shape and box of color around each shape in the legend. And finally with the title of "Cluster."


fviz_clusterI'm able to change these things the same as any otherggplot. Your question doesn't include what you've done to try changing the legend or shape – Ewaewaldtheme(legend.position = "none"). Take a look at the docs for setting manual scales, such as shape: you supply 1 vector to the argumentvalues– Ewaewald