All rows and total of the rows showing same values in power BI
Asked Answered
Y

3

6

I am trying to show "Some Column Name" against "Total Amount" in Power BI.

I am expecting the following results:

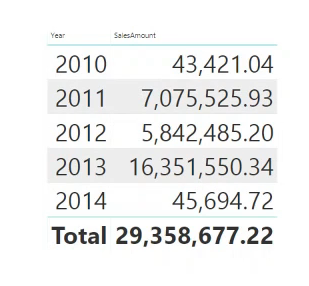
enter image description here

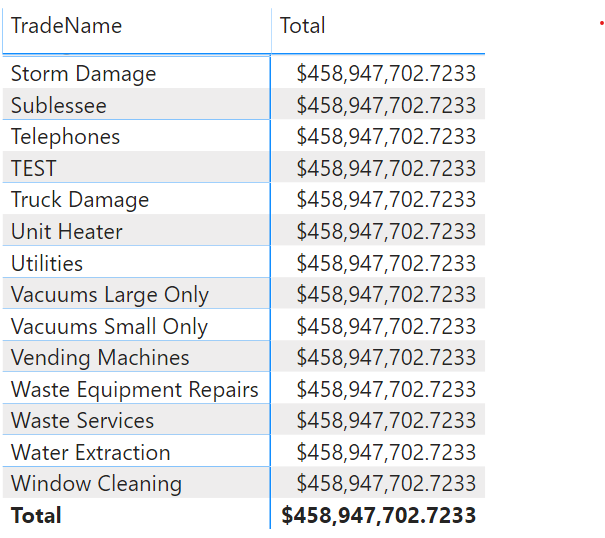
But instead it's showing me the following results:

enter image description here

The current data type is "fixed decimal number" I tried changing it to "Decimal number" or "Whole Number" but it did not work.

Any suggestions?

Yettie answered 20/1, 2020 at 21:12 Comment(3)
Is your data coming from more than one table?Calceolaria
Is the row total a measure or a calculated column or is it a straight pull from a data source?Penknife
@Calceolaria yes, between those two tables there is a common table from which the data is coming. Example, TradeID and AmountID are foreign key to some other table.Yettie
S
5

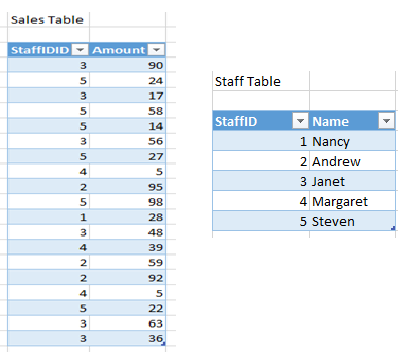
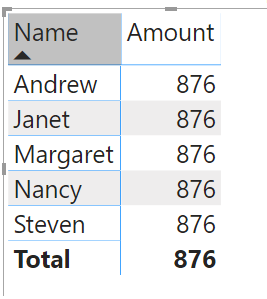
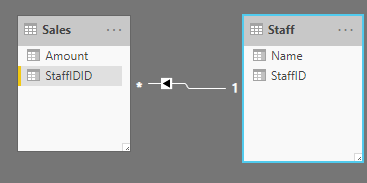
The reason why you have a single repeating value is because you did not create a relationship in powerbi model. If for example you have two tables Sales and Staff and you want to sum all staffs sales.

enter image description here

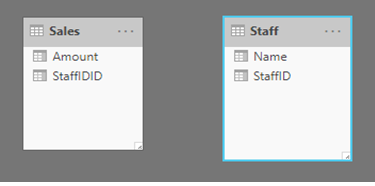
if no relationship created between table in power BI

enter image description here

The output will look like this

enter image description here

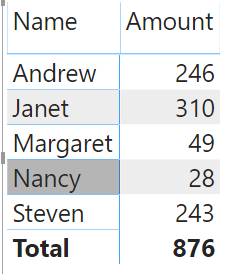
However when a relationship is created between the tables enter image description here

The output will be correct

enter image description here

Saarinen answered 21/1, 2020 at 13:54 Comment(6)
There is a relationship between those two tables.Yettie
@Yettie can we have a sample data so that we can try it and can you check the direction of your arrow in the relationship?Saarinen
I had to manually drag and drop the field from one table (PK) to another table (FK). And when I did that Power BI automatically made a relationship between those two tables as many to many. So in such situation how should I proceed?Yettie
@Yettie many to many is bad for data. what you need to do in this case is to dynamically create another table that holds the unique value of your relationship. that way, you can resolve the issue by using the newly created table as a bridgeSaarinen
@Yettie Also remember to make the relation ship to flow both waysSaarinen
Sample Table @Saarinen The database structure is in the manner as you are describing, you can have a look to the link I have attached. I am still not clear how to fix this issue.Yettie
R
3

This is almost certainly the result of a many-to-many relationship in Power BI. In Power BI if there are connections between two (or more) tables that evaluates to a many-to-many relationship then Power BI is unable to make a distinction between any two rows and instead will project the same value for any given row placed in a visual.

Here's an easy way to visualize this:

Table 1              Table 2
Product | ID    AmountSold | ID
Widget    1         10       1
Smidget   1         20       2
Gidget    2          5       1

When you join these Power BI can't tell the difference in Sales between Widget and Smidget because they have the same ID. As far as Power BI knows Widget could have sold 0 and Smidget sold a total 15, or Widget sold a total 5 and Smidget sold a total 10, etc.

As a result of this many-to-many relationship Power BI panics and evaluates them to be the same result because it can't determine what is right. Widget and Smidget both sold a total of 15:

        Visual
 Product | AmountSold
 Widget       15
 Smidget      15
 Gidget       20

You're experiencing the same issue in your data model, although it is undoubtedly a much more complex relationship than the one I just laid out. You need to go back and determine what table(s) are experiencing a many-to-many relationship and fix the issue. Based on the information you've provided it can't be done from here.

Retirement answered 20/1, 2020 at 23:40 Comment(0)
H
0

1. create a Dimension-Table and do not use the date-column in your fact Table (for either the measures nor your visuals)!

Calendar = 
ADDCOLUMNS(
    CALENDAR("2022-10-01", Today()),
    "Date1", FORMAT([Date], "dd.mm.yyyy"),
    "DateAsInteger", FORMAT ( [Date], "YYYYMMDD" ),
    "Year", YEAR ( [Date] ),
    "MonthNr", FORMAT ( [Date], "MM" ),
    "YearMonthNr", FORMAT ( [Date], "YYYY/MM" ),
    "YearMonth", FORMAT ( [Date], "YYYY/mmm" ),
    "MonthShort", FORMAT ( [Date], "mmm" ),
    "MonthLong", FORMAT ( [Date], "mmmm" ),
    "WeekNo", WEEKDAY ( [Date] ),
    "Weekday", FORMAT ( [Date], "dddd" ),
    "WeekDayShort", FORMAT ( [Date], "dddd" ),
    "Quarter", "Q" & FORMAT ( [Date], "Q" ), 
    "YearQuarter", FORMAT ( [Date], "YYYY" ) & "/Q" & FORMAT ( [Date], "Q" ))

2. Create a Relationship between the new dimension-table and the fact-table!

3. Make sure that the datatype in your fact-table is of the same type as in the dimension-table! If not change it!

4. Disable Date-Hierarchie in your visual!

Heger answered 22/7 at 12:6 Comment(0)

© 2022 - 2024 — McMap. All rights reserved.