How to draw a normal curve on seaborn displot
Asked Answered
F

2

6

distplot was deprecated in favour of displot.

The previous function had the option to draw a normal curve.

import seaborn as sns
import matplotlib.pyplot as plt
from scipy import stats

ax = sns.distplot(df.extracted, bins=40, kde=False, fit=stats.norm)

the fit=stats.norm doesn't work with displot anymore. In the answer to this question, I see the approach to plot the normal later, however it is done on some random data averaged around 0.

Fructification answered 4/9, 2021 at 21:37 Comment(0)
W
4

Single Facet

  • .map can be used
import pandas as pd
import seaborn as sns
import numpy as np
import scipy

# data
np.random.seed(365)
x1 = np.random.normal(10, 3.4, size=1000)  # mean of 10
df = pd.DataFrame({'x1': x1})

# display(df.head(3))
          x1
0  10.570932
1  11.779918
2  12.779077

# function for mapping the pdf
def map_pdf(x, **kwargs):
    mu, std = scipy.stats.norm.fit(x)
    x0, x1 = p1.axes[0][0].get_xlim()  # axes for p1 is required to determine x_pdf
    x_pdf = np.linspace(x0, x1, 100)
    y_pdf = scipy.stats.norm.pdf(x_pdf, mu, std)
    plt.plot(x_pdf, y_pdf, c='r')


p1 = sns.displot(data=df, x='x1', kind='hist', bins=40, stat='density')
p1.map(map_pdf, 'x1')

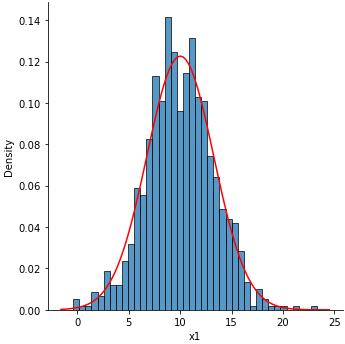
enter image description here

Single or Multiple Facets

  • It's easier to iterate through each axes and add the pdf
# data
np.random.seed(365)
x1 = np.random.normal(10, 3.4, size=1000)  # mean of 10
x2 = np.random.standard_normal(1000)  # mean of 0
df = pd.DataFrame({'x1': x1, 'x2': x2}).melt()  # create long dataframe

# display(df.head(3))
  variable      value
0       x1  10.570932
1       x1  11.779918
2       x1  12.779077

p1 = sns.displot(data=df, x='value', col='variable', kind='hist', bins=40, stat='density', common_bins=False,
                 common_norm=False, facet_kws={'sharey': True, 'sharex': False})

# extract and flatten the axes from the figure
axes = p1.axes.ravel()

# iterate through each axes
for ax in axes:
    # extract the variable name
    var = ax.get_title().split(' = ')[1]
    
    # select the data for the variable
    data = df[df.variable.eq(var)]
    
    mu, std = scipy.stats.norm.fit(data['value'])
    x0, x1 = ax.get_xlim()
    x_pdf = np.linspace(x0, x1, 100)
    y_pdf = scipy.stats.norm.pdf(x_pdf, mu, std)
    ax.plot(x_pdf, y_pdf, c='r')

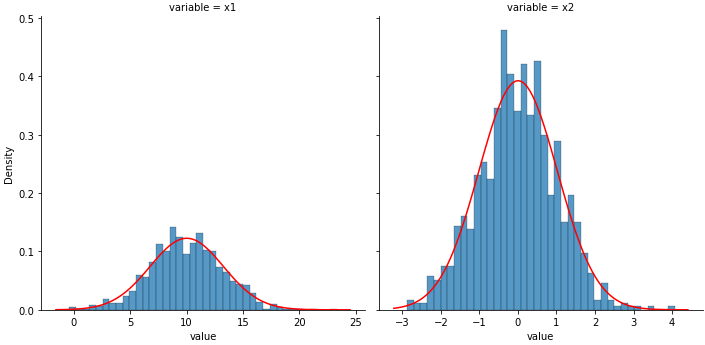
enter image description here

Wellknit answered 5/9, 2021 at 14:16 Comment(0)
S
4

If you want to replicate the same plot as your distplot, I suggest using histplot. Fitting our data to a normal is one line of code.

import numpy as np
from scipy import stats
import seaborn as sns

x = np.random.normal(10, 3.4, size=1000)

ax = sns.histplot(x, bins=40, stat='density')

mu, std = stats.norm.fit(x)
xx = np.linspace(*ax.get_xlim(),100)
ax.plot(xx, stats.norm.pdf(xx, mu, std));

Output

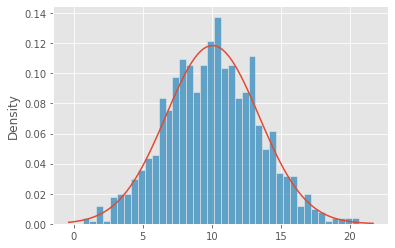
Histrgram with fitted gaussian

Skimmia answered 4/9, 2021 at 22:12 Comment(0)
W
4

Single Facet

  • .map can be used
import pandas as pd
import seaborn as sns
import numpy as np
import scipy

# data
np.random.seed(365)
x1 = np.random.normal(10, 3.4, size=1000)  # mean of 10
df = pd.DataFrame({'x1': x1})

# display(df.head(3))
          x1
0  10.570932
1  11.779918
2  12.779077

# function for mapping the pdf
def map_pdf(x, **kwargs):
    mu, std = scipy.stats.norm.fit(x)
    x0, x1 = p1.axes[0][0].get_xlim()  # axes for p1 is required to determine x_pdf
    x_pdf = np.linspace(x0, x1, 100)
    y_pdf = scipy.stats.norm.pdf(x_pdf, mu, std)
    plt.plot(x_pdf, y_pdf, c='r')


p1 = sns.displot(data=df, x='x1', kind='hist', bins=40, stat='density')
p1.map(map_pdf, 'x1')

enter image description here

Single or Multiple Facets

  • It's easier to iterate through each axes and add the pdf
# data
np.random.seed(365)
x1 = np.random.normal(10, 3.4, size=1000)  # mean of 10
x2 = np.random.standard_normal(1000)  # mean of 0
df = pd.DataFrame({'x1': x1, 'x2': x2}).melt()  # create long dataframe

# display(df.head(3))
  variable      value
0       x1  10.570932
1       x1  11.779918
2       x1  12.779077

p1 = sns.displot(data=df, x='value', col='variable', kind='hist', bins=40, stat='density', common_bins=False,
                 common_norm=False, facet_kws={'sharey': True, 'sharex': False})

# extract and flatten the axes from the figure
axes = p1.axes.ravel()

# iterate through each axes
for ax in axes:
    # extract the variable name
    var = ax.get_title().split(' = ')[1]
    
    # select the data for the variable
    data = df[df.variable.eq(var)]
    
    mu, std = scipy.stats.norm.fit(data['value'])
    x0, x1 = ax.get_xlim()
    x_pdf = np.linspace(x0, x1, 100)
    y_pdf = scipy.stats.norm.pdf(x_pdf, mu, std)
    ax.plot(x_pdf, y_pdf, c='r')

enter image description here

Wellknit answered 5/9, 2021 at 14:16 Comment(0)

© 2022 - 2024 — McMap. All rights reserved.