Customise the x-axis ticks and labels for time series data in LINQPad charts
Asked Answered
M

1

6

I've got a simple CSV log file, reading it into a list and charting it is really easy in LINQPad, but I'd like to update the format and the ticks on the x-axis.

Here's my code:

File.ReadAllLines(@"\\...\ModelTimes.csv")
    .Skip(1)
    .Select(line => line.Split(','))
    .Select(data => new
        {
            CurrentTime = DateTime.Parse(data[0]),
            ModelTime = DateTime.Parse(data[1]),
            ModelAgeHours = Decimal.Parse(data[2]),
            CutOff = 2
        })
    .Where(data => data.CurrentTime.Date == new DateTime(2021, 9, 24))
    .Chart(data => data.CurrentTime)
    .AddYSeries(data => data.ModelAgeHours, LINQPad.Util.SeriesType.Line, "Model Age")
    .AddYSeries(data => data.CutOff, LINQPad.Util.SeriesType.Line, "2 Hours")

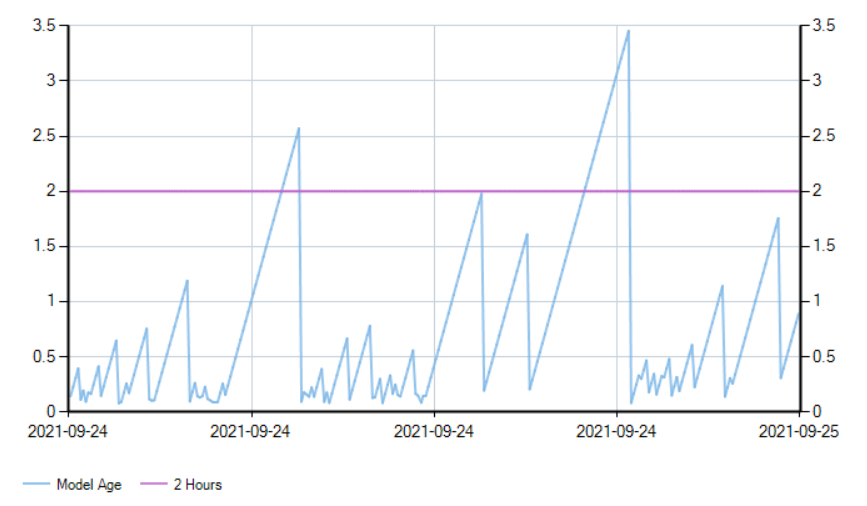
With the output: sample output for a single day As you can see all I get is the date and not the time on the x-axis. Is there some way I can configure the labels and the frequency of the ticks, to something like: 2021-09-24 10:00 and 1 tick every 2 hours.
Midis answered 30/9, 2021 at 2:32 Comment(1)
If you call .ToWindowsChart() you'll get a WinForms Chart object with a Series property that might expose what you need to customize the axes.Projector
M
8

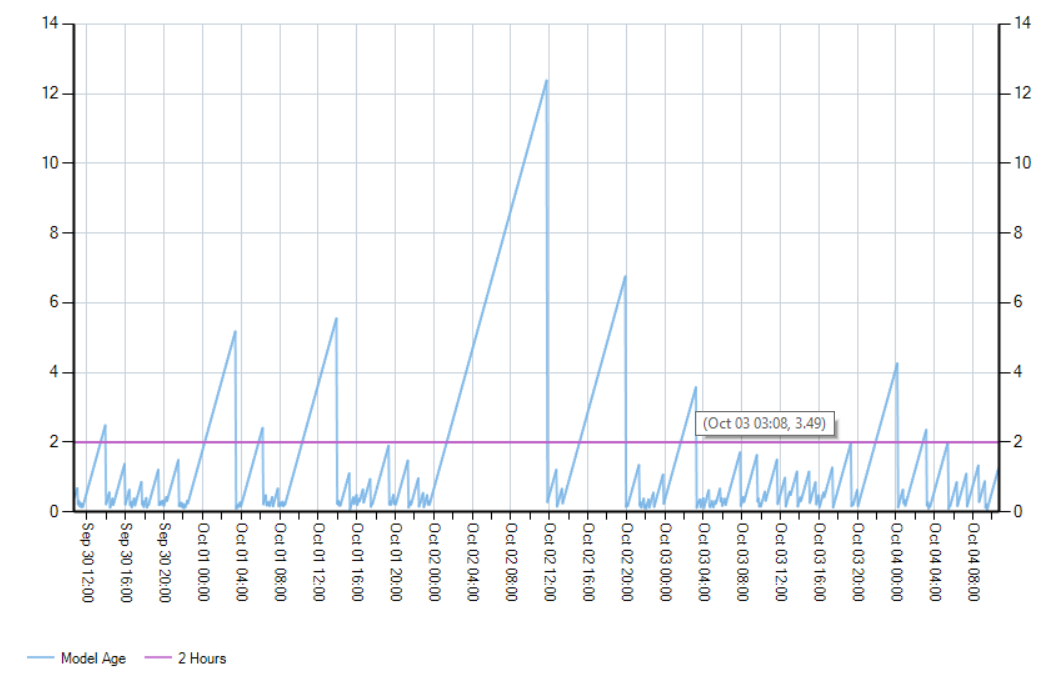
Thanks to Joe Albahari's comment I've got it working and I've also customized the tool tip on the data point.

Using .ToWindowsChart() gives you a System.Windows.Forms.DataVisualization.Charting.Chart from there you can access the xAxis for customization. I also added a handler to the chart.GetToolTipText event to set the custom text to show both the x and y values.

var times = File.ReadAllLines(@"\\...\ModelTimes.csv")
    .Skip(1)
    .Select(line => line.Split(','))
    .Select(data => new
        {
            CurrentTime = DateTime.Parse(data[0]),
            ModelTime = DateTime.Parse(data[1]),
            ModelAgeHours = Decimal.Parse(data[2]),
            CutOff = 2
        })
    .Where(data => data.CurrentTime >= DateTime.Now.AddDays(-4)).OrderByDescending(data => data.CurrentTime);

var chart = times
    .Chart(data => data.CurrentTime)
    .AddYSeries(data => data.ModelAgeHours, LINQPad.Util.SeriesType.Line, "Model Age")
    .AddYSeries(data => data.CutOff, LINQPad.Util.SeriesType.Line, "2 Hours")
    .ToWindowsChart();
var xAxis = chart.ChartAreas[0].AxisX;
xAxis.IntervalType = DateTimeIntervalType.Hours;
xAxis.Interval = 4;
xAxis.LabelStyle.Format = "MMM dd HH:mm";
xAxis.LabelStyle.Angle = 90;
xAxis.MinorTickMark = new TickMark {
        Enabled = true,
        IntervalType = DateTimeIntervalType.Hours,
        TickMarkStyle = TickMarkStyle.OutsideArea,
        Interval = 2,
};
chart.GetToolTipText += (_, e) =>
    {
        if (e.HitTestResult.ChartElementType == ChartElementType.DataPoint) 
        {
            var data = e.HitTestResult.Series.Points[e.HitTestResult.PointIndex];
            e.Text = $"({DateTime.FromOADate(data.XValue):MMM dd HH:mm}, {data.YValues[0]:0.00})";
        }
    };
chart.Dump();   

With the result: Chart with customized x-axis format and tooltip

Midis answered 4/10, 2021 at 2:46 Comment(0)

© 2022 - 2024 — McMap. All rights reserved.